Roadmap 2026
On July 4, 2024, a hurricane raged off the Gulf Coast: Hurricane Beryl.
The National Hurricane Center rushed to predict where it would make landfall.
Scientists there took all the observations they’d collected by planes, buoys, and even spacecraft. Then, they fed massive quantities of data into room-sized supercomputers. And they predicted it would land in Mexico.
Meanwhile, that exact same day, a small desktop computer ran a brand-new AI program.
And without using any of the government’s data, the AI made its own projection using pattern recognition so advanced, supercomputers could not follow it – let alone humans.
But its prediction was quite different than what the big, bad supercomputers foresaw: the AI predicted it would hit Corpus Christi, Texas instead.
Sure enough, look at what happened over the next four days.
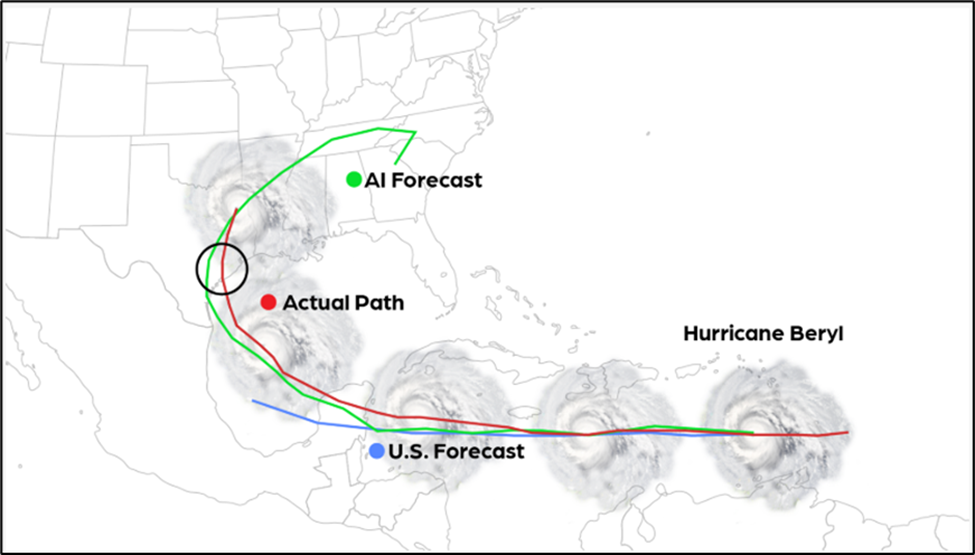
Hurricane Beryl followed the exact trajectory of the AI projection, slamming into Texas. It was one of the most destructive storms in the state’s history.
I’m showing you this example because a lot of folks have seen the results of the AI system we first unveiled back in 2023… And they want to know how we’ve been so successful.
In case you don’t know…
Shortly after ChatGPT sparked a mania, our firm, TradeSmith, used the same machine learning software to create an AI system called “Predictive Alpha.”
We wanted to forecast where a stock is most likely to make “landfall” – up to 21 trading days into the future to the penny.
For example, back on July 27, 2023, it predicted Opendoor Technologies would soon hit a price of $4.87. And sure enough, the stock hit exactly that price just 24 hours later. Our model portfolio booked a 9.4% gain on our recommendation.
Now, that might not sound impressive, but that’s the equivalent of making 35 times your money in a year.
But that was only Version 1.0.
From the very beginning, we knew Predictive Alpha could get even better – a LOT better.
And that’s exactly why you’re here.
The next chapter in the TradeSmith universe: an automated, five-position, rotating portfolio.
And as amazing as that is, we also wanted to give you a taste of what our other TradeSmith tools can do…
In this report, we’ll show you your “roadmap” for the next 12 months. This will be shown by way of a breakdown of the best bullish seasonal periods for four of the most popular indexes the seasonality tool tracks.
Before We Begin: Your Roadmap for the Next 12 Months
Let us be clear before we go further: No tool is 100% accurate 100% of the time.
Anomalies exist. Unforeseen events happen. As the saying goes, “history doesn’t repeat itself, but it rhymes.”
And if it rhymes for long enough… patterns emerge. You can deduce what is likely to happen based on rigorous data sets.
For example…
Let’s say you have two Division 1 college baseball players…
- Player A hit .398 this year and swatted 42 home runs (incredible stats)…
- And Player B hit .253 this year and swatted seven home runs (poor stats).
If we looked at the past 30 years of college baseball data, we’d most likely find that players with incredible stats are more likely to do well as professional players than players with poor stats.
That is just using history and data to make an educated guess – or forecast – of which player will perform better.
Let’s use another example – this time, with stocks.
- Stock A has raised its dividend payment for 17 consecutive years…
- Meanwhile, Stock B has never paid a dividend.
From even this limited information, we can glean that Stock A is more likely to pay a dividend next year than Stock B.
While these two examples are pretty simplistic, they make a critical point: Our tools can forecast where a market or stock is likely to go in the future, but it does not guarantee it.
All that said, we are pretty proud of what we have created here at TradeSmith.
The tool you are about to see – a seasonal, cycle-based overview of four different U.S. indexes – can compare today’s price action against 15 years of historical performance.
Now, timing may shift slightly from year to year. For example, a bullish window flagged to begin on January 21 might start instead on January 25 or February 5.
With that, some indexes have “optimal patterns,” which means they have either consistently shown gains every year of the past 15 years, or only missed one year out of the past 15 years. That’s still 93% of the time.
That data alone is enough to show you what the markets will likely look like for the next 12 months. And that historical data includes the pandemic crash in 2020, two wars, 2025’s tariff tantrum, interest rate swings, and more.
So, let’s break these down a little further and showcase three major markets that traders pay attention to: the Dow Jones Industrial Average, the Russell 2000, and the S&P 500.
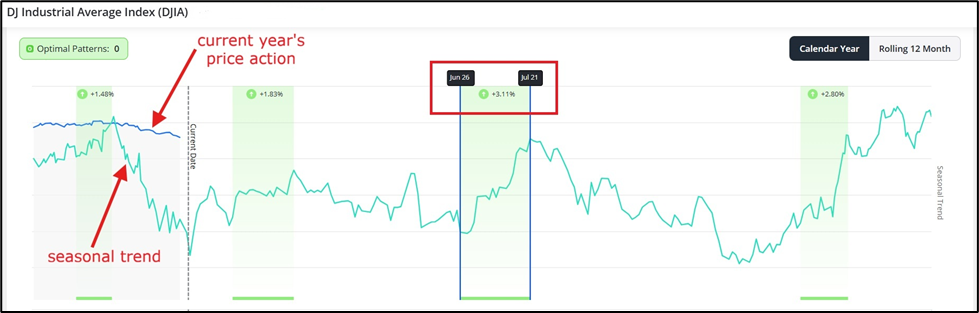
The Dow Jones Industrial Average (DJIA)We’ll start our review with the seasonality chart for the Dow Jones Industrial Average (DJIA).
In the charts provided by TradeSmith’s seasonality tool, current prices are tracked against an aggregate of historical data – going back 15 years by default.
Here’s how to read the chart:
- The current year’s price action is tracked by a dark blue line, while the average price movements of the asset are charted in light green.
- The shaded green vertical areas in this chart represent “green zones” – periods of strong historical bullishness.
- Some indexes have “optimal” patterns – or patterns that have returned the most consistently.
Please keep in mind that the timing of these seasonal patterns may slightly fluctuate from year to year in our system. For example, even if our system shows that a stock has a Green Zone beginning Jan. 31, please keep in mind that next year, the date may be slightly different.
The Dow has several bullish periods over the next 12 months:
- April 5 to April 29
- June 26 to July 21
- October 22 to November 12
- January 27 to February 27
The midsummer (June 26 to July 21) bullish period is the Dow’s best-performing bullish period, returning an average of 3.11% over 15 of the past 15 years.
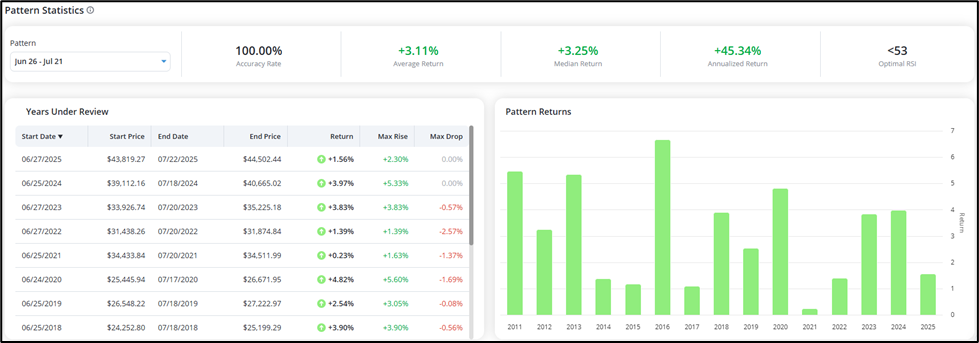
As you can see, some years – like 2016 and 2011 – return higher-than-average gains. But other years – like 2021, 2017, and 2015 – are below average.
No matter the average gain, this has still been a consistently bullish period on the Dow Jones every year for the past 15 years.
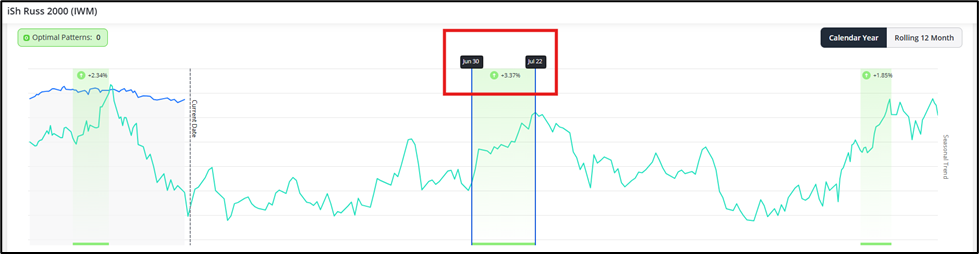
iShares Russell 2000 (IWM)
Next, we’ll cover the iShares Russell 2000 (IWM), which is an ETF that monitors the 2,000 smallest-cap stocks on the Russell Index. Small-cap stocks are inherently riskier than large-cap stocks, but when traders are excited about the future, they tend to start rotating money into small-cap stocks.
The Russell 2000 has several bullish periods over the next 12 months:
- June 30 to July 22
- November 16 to December 4
- January 27 to February 27
Like the Dow, the midsummer (June 30 to July 22) bullish period is the Russell’s best-performing bullish period, returning an average of 3.37% over 15 of the past 15 years.
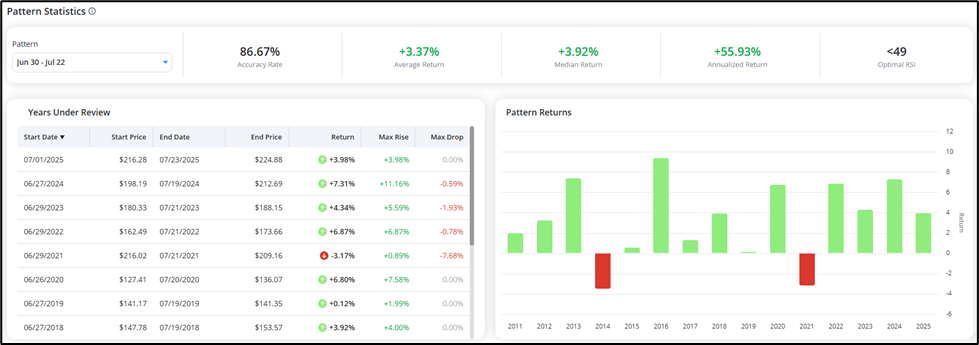
As you can see, some years – like 2014 and 2021 – actually returned small losses during this period. But even with those anomalies, it still averages out to an 87% accuracy rate for this bullish period.
This is where the “history doesn’t repeat, but it does rhyme” saying comes in. History may lead one to believe that wins will happen at this time every year… but clearly, sometimes that is not the case.
Nevertheless, caution is the name of the game here. Nothing is written in stone.
Invesco QQQ Trust (QQQ)
Next, we have the Invesco QQQ Trust (QQQ), which tracks the Nasdaq 100.
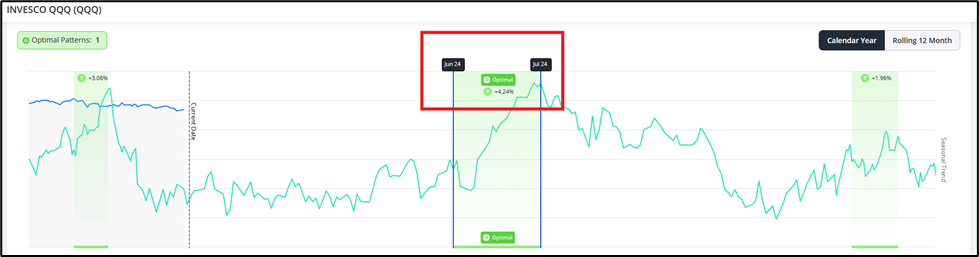
The QQQ has several bullish periods over the next 12 months:
- June 24 to July 24
- November 12 to December 9
- January 28 to February 17
The summer bull runs continue here – with the QQQ coming up on its optimal bullish season coming up soon.
During this approximately-30-day period, the QQQ has seen returns as high as 8.70%, 7.37%, and 5.98% – with 2025 pulling in a 4.66% return.
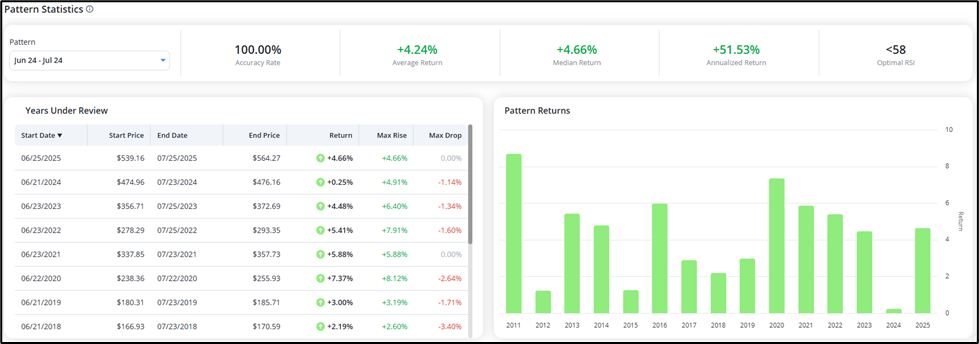
As always, past performance does not indicate future results. This year’s optimal QQQ period may return higher – or lower. Never invest more money into a trade than you can afford to lose.
S&P 500 Index (SPX)
Lastly, we have the S&P 500 Index (SPX). This is one of the most broadly used indexes to track market sentiment.
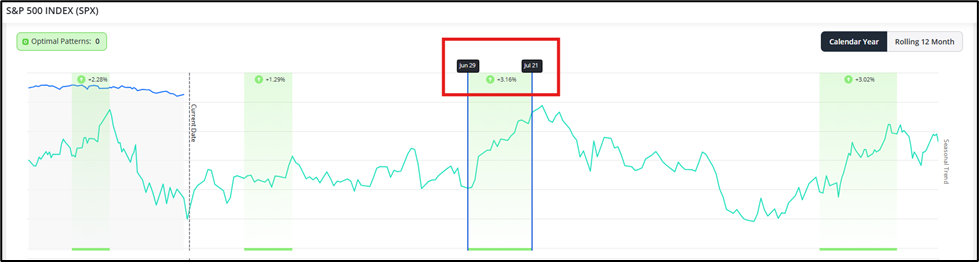
The SPX has several bullish periods over the next 12 months:
- April 13 to April 29
- June 29 to July 21
- October 27 to December 7
- January 27 to February 18
While none of these periods have officially earned the “optimal” pattern label as deemed by our seasonality tool, the SPX does have one bullish period in which it has returned gains every year of the last 15 years. That’s a 100% accuracy rate!
The period falls from June 29 to July 21. Remember, these dates are an approximation and could start earlier or later than those exact dates.
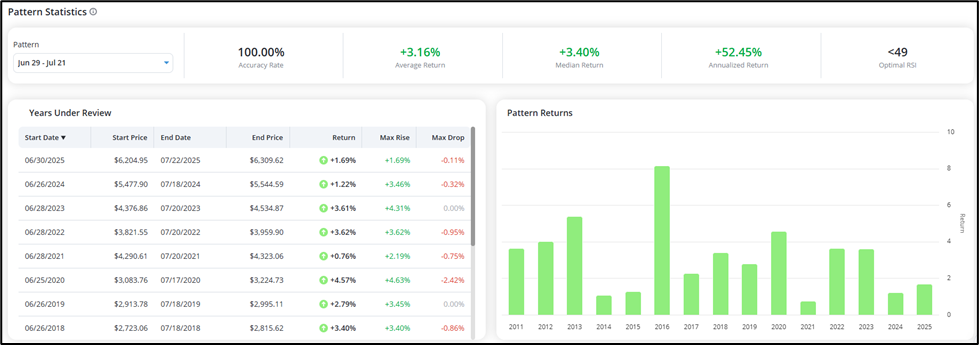
In 2013 and 2016, it returned gains of 5.37% and 8.16%, respectively. And though gains in 2024 and 2025 were smaller in comparison, the SPX has still returned an average of 3.16% every year for the past 15 years.
It’s Go Time
By targeting these bullish seasonal windows, you can unlock the full potential of the stock market, even in times of overall market weakness.
As we said earlier, nothing is guaranteed. You should never risk more money in a trade than you are willing to lose. The stock market can endure unforeseen events that could cause major drops, even in seasonally bullish period.
However, by studying these consistent periods of positive returns in the past, we have a better idea of how the market will act in the future.