12 Stocks to Buy This Year: a Seasonality Watchlist Portfolio
INSIDE THIS REPORT:
Introduction: How Seasonality Made Me an Excellent Trader
What You Need to Know Before You Begin
12 Stocks to Buy – One Each Month of the Year
Introduction: How Seasonality Made Me an Excellent Trader
By William McCanless, Senior Seasonality Analyst, TradeSmith
If you’re like me, you got into trading not knowing the first thing about seasonality.
Personally, I got into trading because I wanted to make a lot of easy money really fast.
I wanted to click a button and “cha-ching” myself to riches.
And I knew it was possible to make a lot of money fast because I had been working with some of the largest financial publishers in the world, where analysts were delivering huge gains.
I figured if they can do it, I can too.
Well, guess what? It wasn’t easy at all.
At least- not when you take the path most people take – which is to try each and every shiny indicator and strategy you can find.
That’s how I started. And I made no money the first four years.
I was like a kid walking through the Bass Pro Shop…
All those shiny, colorful lures!
Surely, if I bought this one…and that one…and this one…and that one, I’ll be able to just toss it into the river, creek, pond, or surf and load up!
Of course, if the first one didn’t work, surely the titanium, NASA-technology, ultraviolet, sonar-pitched, scented “catfisher” would do the trick.
But as my own Dad would always tell me, “These are designed to catch fisherman, not fish.”
It’s similar in trading – all those indicators and strategies are more about capturing traders than gaining profits.
But boy, do they look cool (and easy).
In addition, I got into just about every asset you can think of:
- Stocks – shares of companies like Apple or Tesla
- Options – contracts that let you “bet” on stocks without buying shares
- Futures – contracts to buy or sell commodities (like gold or oil, in my case) at future dates. Like options, you can just trade the contracts…not the gold bars, etc.
- Currencies – euros, yen, etc.
- Crypto – bitcoin and other digital currencies
None of those are a problem, really, unless you’re using crazy strategies and don’t know what you’re doing.
And I didn’t.
Throughout this four-year “meat grinder” of learning trading, I lost hundreds of thousands of dollars.
So much for easy money.
The good news is that I learned a whole heck of a lot.
I learned patience and emotional control, for one thing. Those are lessons I then transferred to many other aspects of life.
Money wise, though, the lesson that stuck was this:
Markets are highly cyclical going back 10…15….30…40 years (or more).
The cycles are seasonal, in fact.
It was in researching futures trades that I stumbled into it. At specific times of year, certain trades were profiting – not every single year – but at least 80% of the time.
- One, for example, involved trading live cattle contracts from Dec. 10 to Dec. 26 over the past 30 years.
- Or going back the last 15 years, trading Canadian dollar and British pound contracts from Dec. 20 to Jan. 7.
What do commodity markets and currency action from 15 and 30 years ago have to do with today?
If something happened 80% or 87% of the time, as those did… over the last several decades, through various policy environments, administrations, and geopolitical environments… then it’s probably for a reason.
That reason – at the end of the day – is simply this:
Human nature never changes.
The stock market in 2025 is actually a great example.
What a crazy year, right?
- Stocks got off to a strong start…
- Started crashing in February when President Trump was getting ready to levy tariffs…
- Down 20% – officially a bear market – once he did so, on “Liberation Day”…
- Now – plot twist – stocks not only climbed out of that hole… By October, they were actually 14% higher than they’d been in 2024.
Well…is it crazy…
Or is that just what happens the year after a presidential election?
Here at TradeSmith we can map out those election cycles for you, in terms of stock prices.
And here’s what history shows us:
When you look specifically at the last 18 post-election years on the S&P 500 (from 1953 to 2021, the most data we have)…
From Feb. 6 to April 6, the market dropped 12 out of those 18 post-election years for an average -1.6% return.
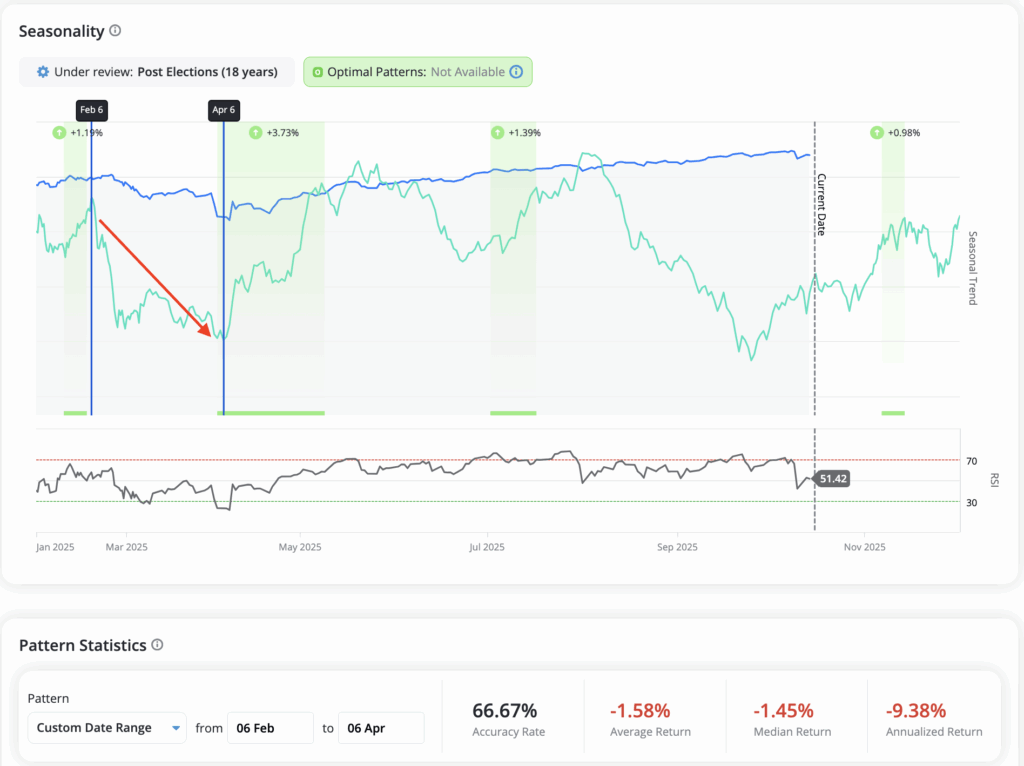
That’s nearly the exact same timeframe that the markets dropped this year:
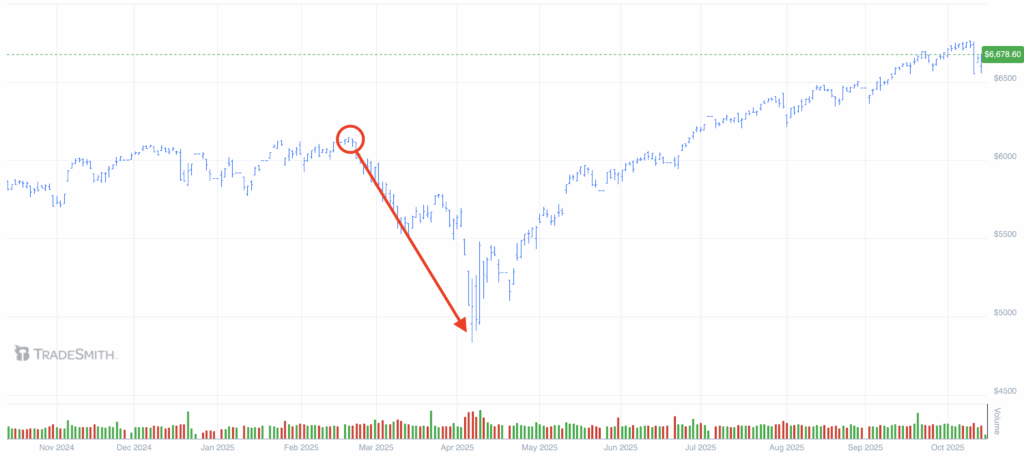
And when was Trump’s “Liberation Day” announcement?
It was April 2. Right as that bearish seasonal pattern ended.
Then, within a few short trading days, stocks had climbed 37.5% off of the low point:
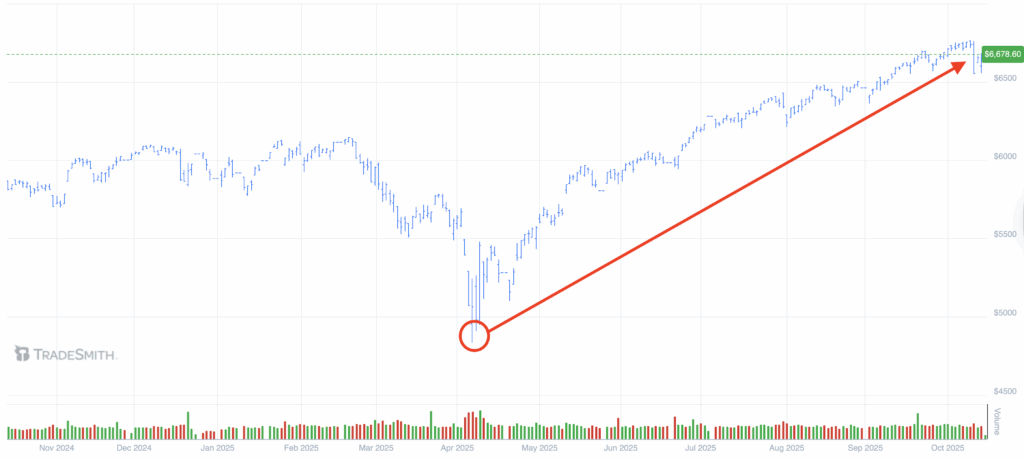
Historically – it just tends to happen like that in post-election years.
After that February-April crash, there comes a glaring buy signal…
Sometime between about April 4 and May 9, the S&P has risen 94.4% of the time. Here’s that next part of our seasonality chart:
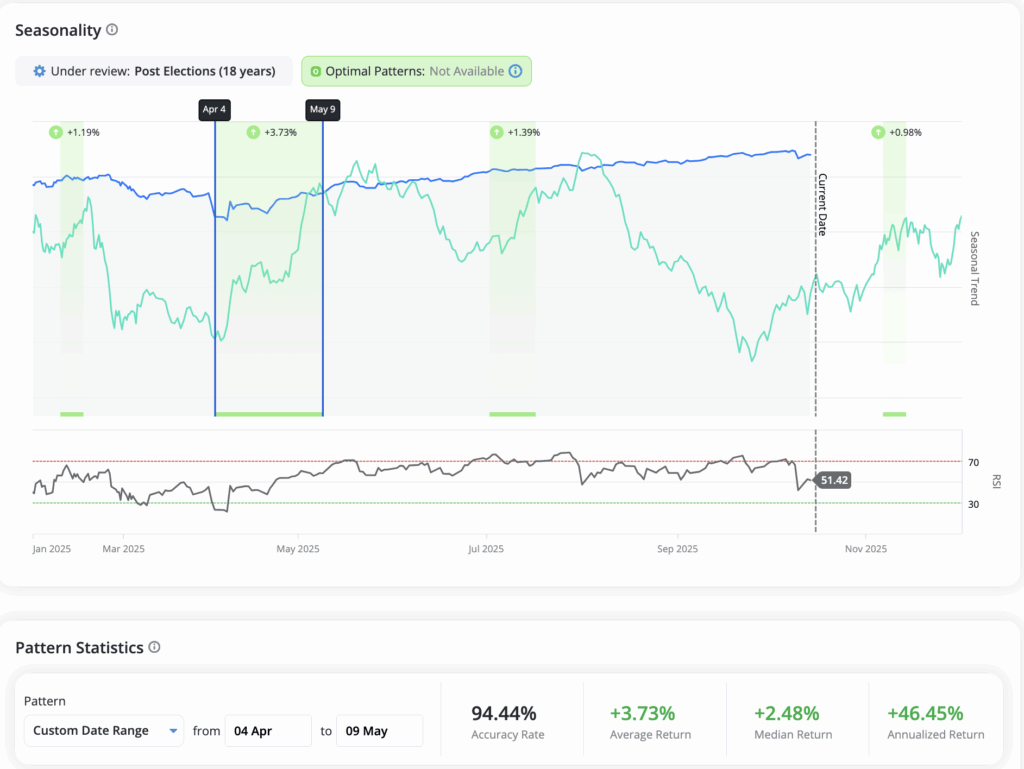
In other words – you could have caught that massive 16.8% drop from Feb. 6 to April 6…
And you could have timed the EXACT rebound by following seasonality and literally ignoring the news.
That’s the kind of thing that has me ensuring each trade idea has some kind of statistically significant seasonal window going back at least 15 years to inform my bias and confirm the trade.
The results were spectacular for my personal accounts.
Suddenly trading became…pleasant.
I had a reason for my trades based on history, statistics, and relative value.
And so I began trying different ways to apply this seasonality.
I knew this strategy worked on the major indexes – the S&P 500, Nasdaq 100, and the Dow Jones Industrials – because I traded them successfully in the futures market.
But up until that point, I’d mainly used this strategy on commodities and currencies.
So, with the help of the team at TradeSmith, we started “beta testing” the idea on individual stocks and ETFs.
And even in a raging bull market over the last few years, for example, we were able to pinpoint extremely accurate turning points to the downside, as well as bullish trades, with the help of our TradeSmith Seasonality tool.
Using the power of our “$30 million computer,” our team of 74 human researchers looked back at the past couple decades of historical data on stock prices. And they used that data to see how different trading strategies would have performed over time (a “backtest”). Millions of data points, in fact.
We tried plenty of different filters, but the best results came when we kept them very simple…and were just very selective about which stocks – at which times – we were willing to trade.
That was how our Optimal Seasonal Patterns were born, which we’ve used to bring you these 12 trades, one each month of the year ahead.
The results prove how effective a seasonality trading strategy can be.
Platinum-standard backtests going back to 2006 show the SPDR S&P 500 ETF (SPY) gaining 412%.
Yet this strategy gained more than double that: If you’d traded about 50 stocks each year during their Optimal Seasonal Patterns….risking an equal dollar amount per trade…you’d have made 857% over the same period. Even better – the average hold time was only 19 days, with a win rate of 83%.

With higher level subscriptions, like The Seasonality Investor, you can actually find juicy trade set-ups on your own in TradeSmith Finance.
But for now – let’s start with these 12 recommendations.
What You Need to Know Before You Begin
In a bit, you’ll hear exactly one stock you can buy in each month of the year ahead – in advance. And these trades will sound REALLY good…or we wouldn’t be recommending them.
Just remember these things…
1. Past Performance Does Not Guarantee Future Results
The historical gains of these 12 stocks happened in 14 or even 15 out of the past 15 years. That’s 100% of the time.
Does that mean the stocks are going to keep going up during that seasonal window, 100% of the time, forever?
No. Probably not. When we created the strategy, we found that trades which worked out 80%-100% of the time in the past…worked out 60% of the time for us, in our real-life test.
I don’t mention this to scare you – because you can still make a lot of money this way, as long as the winners are big and the losers are small…
I say this just so you know how important it is to trade responsibly. And on THAT topic…
2. Never Invest More Money Than You Are Willing To Lose
For most of us, that’s a fraction of our savings. Yours might be more if you are young and have time to bounce back from any losses. Yours might be less than others if you’re older.
To gauge this, if you are very new to trading, you might try “paper trading” the seasonal patterns first.
That’s where you enter in a (fake) trade order the same way you would in real life – in a real broker account – but without putting real money on the line. You can still track how your paper trades go over time, though, and see how much (fake) money they make. Speaking of which:
3. You’ll Need a Broker
I’d also suggest using a simple-to-understand brokerage account that is designed for active traders.
For example:
- Robinhood
- TradeStation
- WeBull
- ThinkorSwim (now part of Charles Schwab)
But if you do happen to have a broker already and you want to stick with what you know, that’s fine, too.
And whether you start out paper trading or really trading…
You’ve then got to decide how much of the total to put into each, individual trade.
4. Start Small
Keep in mind – “one Optimal Seasonal Trade per month” doesn’t mean “go all-in on this one stock.”
My Golden Rule is to never risk more than 5% of an account on any single trade.
If you risk 5% of your account, that means you would need to have 20 full losses in a row to go to zero.
Now, that is probably not going to happen. Especially since these are not penny stocks. They are large companies – mostly household names.
But if you look at it as, “How much am I willing to lose on this trade?” …
Instead of “How much money can I make on this trade?” …
You won’t be agonizing over it. You won’t lose an ounce of sleep. You’ll be able to put each of these trades on – then simply let them work.
12 Stocks to Buy – One Each Month of the Year
Now that you’ve decided how much to invest, and where, here are each of the trades and how they work – start to finish. The timing of these Optimal seasonal patterns may slightly fluctuate as we get new data each year. For example, even if our system shows that a buy zone opens up on March 23, please keep in mind that next year, the date may be slightly different. It may be March 16 or March 30. Some years, there may be none at all. So, the ideas listed here are only for the specific 12 months ahead.
| Stock Ticker | Company | Pattern Start Date | Pattern End Date | Average Return | Smallest Return | Biggest Return | Historical Accuracy |
| CCL | Carnival | Oct. 19, 2025 | Nov. 8, 2025 | 9.83% | 0.21% (in 2012) | 36.04% (in 2020) | 100% |
| SHW | Sherwin-Williams | Nov. 1, 2025 | Dec. 6, 2025 | 6.59% | 0.002% (in 2019) | 20.28% (in 2023) | 100% |
| CB | Chubb | Dec. 14, 2025 | Dec. 29, 2025 | 2.23% | 0.49% (in 2017) | 5.30% (in 2015) | 100% |
| AVGO | Broadcom | Jan. 27, 2026 | Feb. 17, 2026 | 5.31% | 0.40% (in 2010) | 17.66% (in 2011) | 100% |
| BKNG | Booking Holdings | Feb. 3, 2026 | Feb. 18, 2026 | 7.58% | 0.28% (in 2023) | 19.33% (in 2016) | 100% |
| ED | Consolidated Edison | March 23, 2026 | May 4, 2026 | 5.21% | 0.07% (in 2016) | 18.21% (in 2020) | 100% |
| AN | AutoNation | April 13, 2026 | July 13, 2026 | 13.28% | 0.57% (in 2015) | 34.22% (in 2023) | 100% |
| AMZN | Amazon.com | May 26, 2026 | July 13, 2026 | 10.25% | 1.25% (in 2010) | 28.17% (in 2020) | 100% |
| DHI | D.R. Horton | June 28, 2026 | July 23, 2026 | 8.11% | 0.15% (in 2015) | 25.28% (in 2024) | 100% |
| BX | Blackstone | July 10, 2026 | July 30, 2026 | 7.62% | 0.48% (in 2011) | 16.28% (in 2021) | 100% |
| AJG | Arthur J. Gallagher | Aug. 24, 2026 | Nov. 10, 2026 | 8.07% | 0.49% (in 2012) | 20.12% (in 2011) | 100% |
| TSLA | Tesla | Sept. 4, 2026 | Sept. 19, 2026 | 6.77% | -9.34% (in 2014) | 14.38% (in 2022) | 93.33% |
These are the statistics on the seasonal patterns our tool detected, including:
- The Average Return for the highlighted pattern. This is based on historical data; it may or may not play out that way in this specific year. That’s something to keep in mind.
- The Smallest and Biggest Return seen in the past 15 years, which make up that average.
- The historical Accuracy Rate, or the percent of cases when the stock price moved up within the specific window of time in each seasonal pattern.
Most important, if you are seeing profits before the Pattern End Date, feel free to take them. You never go broke taking profits, as we traders like to say.