The InvestorPlace Top 10: The 10 Best Stocks According to TradeStops
If you have any money in the stock market… chances are, you’re unsure what you should be doing with your investments right now.
Every day, it seems like you see one headline striking a bullish tone. Then a few days later, you’ll see the complete opposite, with a very bearish sentiment.
Mixed messages like this will scare most folks into making the worst possible decisions about their investments. Combined with the extreme market volatility we’ve seen lately, many investors are scared today.
However, this is a time when fortunes can be made – and lost. The choices you make today could be the difference between seeing exceptional profits in the future… or getting crushed if the “worst-case” scenario continues to play out.
If you have any money in stocks right now or own mutual funds in your 401(k) or IRA, and you’re just blindly selling everything out of fear… you aren’t properly prepared for the year ahead.
Conversely, if you’re sitting in cash and missing out on the recovery we’ve seen recently because you don’t know when or what to buy, you’re also missing out.
Either one of these mistakes could potentially cost you thousands, perhaps even tens of thousands of dollars before the next stock market crash even begins.
What we are concerned about is this: There are specific moves you should be making with your money right now. If you’re sitting in cash strictly out of fear, you may be leaving tens of thousands of dollars on the table.
So, in this Special Report, we’ll talk about the one number you must consider when timing your investments – both buying and selling.
And we’ll show you the No. 1 thing you can do today to make sure you’re prepared to profit, no matter what happens to stocks this year.
As a special bonus, we’ll also tell you how to access your list of the top 10 stocks from InvestorPlace analysts’ portfolios – as identified by TradeStops. These are stocks that you can consider adding to your portfolio today.
What Makes a Stock Gain or Lose Value?
If the primary goal is to purchase stocks and other investments that go up in value, what factor determines whether a stock moves up or down?
The answer to that question is what investors speculate on every day to create their fortunes and secure their legacies.
The easy answer is “supply and demand.”
It’s Economics 101. Demand is created when there are more buyers than sellers for a specific stock. Consequently, the price rises. A larger number of sellers than buyers forces sellers to compete for your business and prices begin to fall.
There’s also a consideration about the performance of the issuing company — whether its value will rise or whether it can meet its financial obligations.
Confidence in the company to do well and project stability goes a long way toward a positive outlook on that company’s stock for the future, which enhances demand.
Other factors affecting stock price include corporate activity and performance data. Or it could be factors outside the company’s control, such as news-worthy events… like a pandemic and inflation concerns.
Then there are rumors, interest rates, natural disasters, technological advances, and other causes far removed from the company… all of these can affect a stock’s price.
Most successful investors only invest in stocks with strong momentum and a favorable trend.
Trend focuses on the current technical condition of the stock. How long has the stock been moving higher and how strong is this move?
By looking at the momentum and trend for a potential new stock, the investor will have a good idea of which stocks and options have the potential to be the most successful before even investing a penny. They should know if the stock has a healthy uptrend and whether it would be a smart buying decision.
Harnessing Volatility for Profit
Some stocks are riskier than others, but how can you tell the difference?
Volatility refers to the amount of fluctuation – or “noise” – that naturally occurs in the price of any stock. It can also be regarded as a measurement of risk. For example, a stock that fluctuates by as much as 30% means that the stock price could rise that much, but it also means the price could fall equally as far.
Stocks move up and down as a natural function of the market. Harnessing this movement creates opportunities for investors to realize gains.
But stocks don’t all fluctuate at the same rate. Some stocks dip further and rise higher than others, whereas less volatile stocks, or less risky stocks, don’t fluctuate as much.
Depending on what your investing goals are, it may make sense to acquire some riskier investments with the opportunity to rise sharply in value. It’s just that you’ll need to be prepared for the possible fall as well.
Think of it like this: Knowing the amount of volatility within a stock means you can buy it and already know how much volatility is “normal.” Even if you watch a stock lose some value, you won’t have to panic, because you’ll know — in advance — the stock’s normal range volatility, even before you decide to buy.
That’s powerful. You can even know, based on the volatility of a stock, whether it’s a stock you even want to purchase based on your investing style and risk tolerance. Plus, you can build out your exit strategy before you even purchase — and ensure that you can stay in to maximize your potential gains.
Knowing your limits and what you’ll tolerate in terms of risk means you can use volatility to determine how much to invest in any stock. By “position-sizing” their stocks for volatility, investors gain greater opportunities to make more money while also risking less.
How? By understanding volatility, you know when to invest more into your safe stocks and less into your riskier securities. Your decisions are then based on research-backed information, not guesswork.
Quantifying Volatility
The challenge is quantifying volatility in any meaningful way.
We took this challenge and have developed a way to reliably quantify the exact amount of volatility in a particular stock. We call it the Volatility Quotient, or VQ. It measures the amount of noise, risk, or fluctuation of a stock and can be expressed as a percentage. This information can help you make investing decisions based on the volatility of any equity.
For example, our research found that volatility quotients between the range of 5% and 15% are considered low risk. Between 15% and 30% is medium risk, and between 30% and 50% is high risk. Anything higher than 50% is deemed a “sky-high” risk.
Using this measure, you can compare one stock against another, aligning the VQ with your investing goals to make better, more informed, and potentially more profitable investing decisions.
For example, let’s say you have a portfolio with 10 stocks, all with a low VQ in the 10% range, and you’re looking at two stocks, one with a higher VQ of about 25% and one in the lower range, similar to the others.
You may decide to take the risk (betting the stock’s value will go up) since your other stocks probably aren’t increasing as much in value based on their lower VQ. Plus, you’ll know just how far to let any of your stocks — especially the riskier ones — fall before you pull the plug, protecting yourself from more loss.
A real-world example exists in comparing the VQ of Johnson & Johnson (JNJ) to Tesla (TSLA).
According to TradeStops, as of Sept. 20, 2024, Johnson & Johnson had a VQ of only 12.58%. As you’ll recall from the description above, anything between 5% and 15% is considered low risk.
By comparison, Tesla had a VQ of 47.01%.
Depending on your personal risk tolerance, or how much you can safely put at risk in search of a gain, either stock could be a potential fit for your portfolio. But, knowing the VQ up front means you’ll be armed with knowledge going in.
There are other factors you’ll want to consider besides VQ, such as the current health, direction, and trend of a stock. TradeStops can help with that kind of analysis as well.
Leveraging Volatility for Even Greater Gains
Now that we understand the power of knowing how much volatility exists within a stock, how can we leverage that knowledge to help produce higher returns?
Before we answer that question, let’s explore a powerful tactic to help lock in and preserve gains while protecting yourself from loss.
You may have heard of a “stop-loss order” before. That’s one way you protect yourself from losing too much money on a stock. For example, let’s say you purchase a stock at $10 per share.
But the next day the price drops to $2. You’re out $8. Or, you could set a stop-loss order, so that if the price drops to $6 (for instance), you automatically sell.
This means you’re only on the hook for the difference between your purchase price and the stop-loss price. In the example above, that’s $4, compared with the $8 you would have lost if the stock continued to fall.
So far, so good. But that doesn’t account for what happens when the stock price goes up first and then falls to your stop-loss exit price. What if the same stock you bought for $10 moves up to $15 and then falls rapidly back down below $6. Well, you are indeed protected from any further loss, but you’ve also missed out on all gains occurring from $10 to $15.
Investing Profit Multiplier
Albert Einstein is alleged to have called compound interest, “the greatest mathematical discovery of all time.” Even if Einstein didn’t utter those words, compounding in terms of investing is a concept worth exploring.
Compounding occurs when an investment asset – such as a stock – generates earnings, and those earnings are turned around and reinvested, hopefully generating even more earnings.
Therefore, compounding refers to generating earnings from previous earnings. It’s one way you can help grow your wealth exponentially. For example, $10,000 invested with a 20% annual return grows to nearly $1,000,000 in just 25 years. That works out to a staggering 9,900% increase in your investment!
How does this happen? Easy. $10,000 invested in the first year and growing 20% means at the end of the year you now have $12,000.
You start year two with $12,000, which theoretically grows another 20%, giving you $14,400. By year three, you’re up to $17,280 — and in year four, you have more than doubled your initial $10,000 investment to $20,736.
This 20% annual return is for illustrative purposes, highlighting the money-multiplying power of compounding interest. But, even if you fall short of that ideal, any amount of return compounded over time can potentially generate an incredible nest egg.
Even a modest stake of $10,000 invested at an annual return of only 7% doubles in just over 10 years.
And, that’s all without adding one more dollar to your $10,000 stake. Compounding is a concept that can help make you rich. The trick is identifying investments that can provide potential returns in amounts to achieve these amazing results.
If you have more to invest, that’s even better. Here’s what can happen to $100,000 invested at various rates of return over a 30-year period:
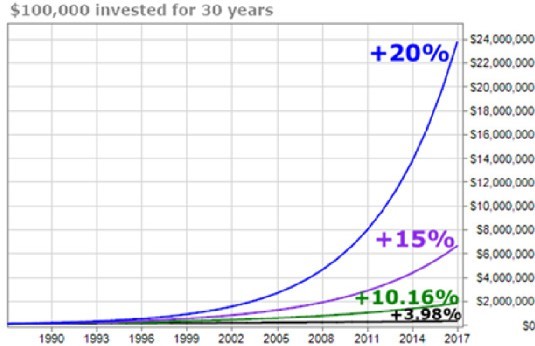
Crazy, right? Compounding requires two ingredients to work: reinvested earnings and time. It’s a long-term strategy. The more time you have and the greater your annual return, the better your ultimate results will be.
Have an Exit Strategy
Even before making the final decision to buy a stock, successful investors always have an exit strategy in mind. This is critical because it can make the difference between holding on to a stock for too long and taking a huge loss or selling a stock and making a large profit.
Creating an exit strategy also protects investors from personal blind spots. They will not allow fear, greed, or misguided loyalty to a stock stand in the way. The exit strategy gives investors the freedom to know when it’s the right time to exit a stock or other investment.
Investors don’t need to worry if the stock might suddenly drop off. They know that their exit strategy is financially sound and backed by the stock’s performance and trend.
Applying the VQ to InvestorPlace’s Analysts
To put these principles to work, we ran every stock recommended by Eric Fry, Louis Navellier, and Luke Lango through our Pure Quant portfolio builder. This tool uses each stock’s Volatility Quotient and Health Status, along with any other criteria you choose to build a ready-made portfolio you can invest in today.
To access our “InvestorPlace Top 10: The 10 Best Stocks According to TradeStops” simply log in to your TradeStops account, click My Portfolios, and then Manage. You’ll see this exclusive portfolio – custom-built just for you – already loaded into your account.
What Does This Mean for Your Money?
Nobody really knows what the future holds or what might happen next. We’ve spotlighted 10 stocks that are worthy of attention in the coming months. We believe these stocks have strong potential; they are already in a healthy, normal state of volatility and are trending up.
Regardless of what happens next, your subscription to TradeStops can help you find the best stocks to buy and determine the exact day to enter any stock you’re watching. Not only will they help you decide what to buy, but they will also help you know when to buy and how much to buy to protect your portfolio from unbalanced risk.
Best wishes!