Listen to the audio version of this article (generated by AI).
Editor’s Note: Today, we’re handing the floor to Marc Chaikin, founder of our corporate partner Chaikin Analytics. For 60 years, Marc has told investors to ignore the noise. Below, he explains why he’s breaking that rule, and how Andy and Landon Swan, the brothers behind our MegaTrends service, showed him a signal hiding inside it.
Marc and the Swans made their full case at last week’s Stock Tsunami Event, along with three free stock ideas: two buys and one sell. If you missed it, the replay is still available for a limited time. Click here to watch.
I got my start on Wall Street in 1966.
Back then, there wasn’t much in the way of investor tech.
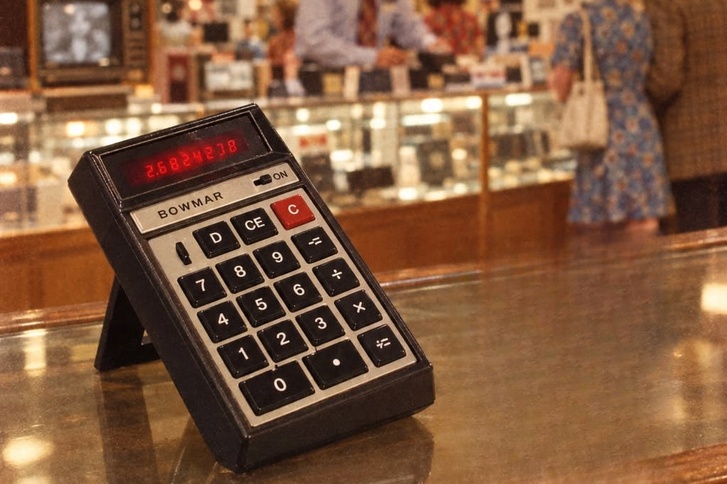
In the 1970s, the big breakthrough for me was the pocket-sized Bowmar Brain electronic calculator.
Every morning, I opened the newspaper and sat down with my Bowmar Brain. I tracked hundreds of stocks by hand, logging trading volume, closing prices, and the gap between where each stock opened and where it closed.
That gap told me something no price chart could…
If a stock closed above where it opened, buyers had won the day. If it closed below, sellers were in control. And when it happened on heavy volume, I knew it wasn’t the little guy doing the buying or selling… it was the big institutions.
This process helped me see where the big money was going before it showed up in the price.
Then, around 1978, the papers stopped printing opening prices. And my edge evaporated overnight.
I was furious for a while. Then, I went back to the numbers the papers still printed, and I built my first indicator: the Chaikin Money Flow. Hundreds of hedge funds, banks, and brokerages still use this indicator today to gauge whether big money is buying or selling a stock.
Decades later, I built it into something bigger…
I call it the Power Gauge.
This one-of-a-kind system looks at 20 different factors behind a stock, Chaikin Money Flow among them, and boils them down to a single rating… “bullish” or “bearish.” It does that for more than 5,000 stocks, every day.
The Power Gauge has pointed me to stocks like AI memory maker Micron Technology (MU) before it soared 970% in a year, electronics maker Celestica (CLS) before it climbed 6,600%, and chipmaker Nvidia (NVDA) before it skyrocketed more than 50,000%.
Every year since 2016, the Power Gauge has flashed “bullish” on at least seven of the 10 best-performing stocks in the S&P 500 Index.
Losing those opening prices turned out to be one of the best things that happened to me. It taught me something I’ve relied on ever since…
When the data changes, your edge changes with it.
This year, it changed again. And what I’ve discovered has led to the biggest – and potentially most profitable – change to my strategy in 60 years.
The Demand Wave I Couldn’t Measure
The Power Gauge looks across companies’ financial statements, earnings reports, and technical indicators… as well as what analysts are saying and what insiders and short sellers are doing with their money.
Then it boils all that down to one simple rating… “bullish” or “bearish.” When a company’s overall picture looks great, the Power Gauge turns green. When the picture looks poor, it turns red.
Six decades of watching money move around has taught me something the Power Gauge alone can’t tell you…
The biggest trends come in two waves.
First comes the demand wave. Millions of people fall in love with a product. They buy it and talk about it online. This generates buzz and excitement around the product, which leads to even more buying.
Then – weeks, or sometimes, years later – the money wave hits. Wall Street notices, and the big buyers pile in.
My first indicator was built to catch that second wave the moment it starts. So is much of the Power Gauge. But every one of those money waves started with a demand wave nobody was measuring – including me.
For 60 years, nobody had figured out how. The Power Gauge runs on public data, the same numbers nearly every other investor studies in one form or another.
Everything outside that data, I treated as noise. But now…
I’m Breaking This Rule After 60 Years
If you’ve read my work, you’ve heard me say it hundreds of times: Ignore the noise.
I’ve said it through 10 bear markets and every mania, panic, and crash along the way. Headlines, pundits, and flashing charts were all noise. My job was to tune them out and follow the data.
Then, earlier this year at an investor conference in Las Vegas, I listened to two brothers describe consumer sentiment data they’d been tracking since 2012.
It wasn’t in financial statements or analyst estimates. It was what millions of Americans were saying online every day about the products they’re buying or want to buy – the largest real-time poll of purchasing intent.
Their names are Andy and Landon Swan. And to my amazement, they were finding signals in something I always took to be impenetrable noise.
I’d tried something like this once…
In 2010, I brought one of the leading names in AI into my company to work with this kind of data. He couldn’t figure out how to turn it into stock ideas.
But not long after that, the Swan brothers did…
Two Brothers – 23.5 Terabytes of Data
Andy and Landon have a long record of being early on major trends – from livestreaming their trades in the mid-2000s, long before anyone else was doing it, to building one of the first social networks for investors. But what really got my attention was the online data they were tracking.
Their idea is simple. People “vote” with their dollars every day. When they post about what they buy, you can watch that vote in real time.
That’s why the Swan brothers have spent more than $10 million building a system to collect those votes, with data going back more than a decade.
Today, their system pulls from social media platform X (formerly Twitter), where they’re a preferred partner with direct, real-time access. It also draws on Facebook, Reddit, YouTube, search trends, web traffic, app downloads, and more.
They’ve collected 23.5 terabytes of this kind of data. That’s roughly double the entire book collection of the Library of Congress.
When I started, the stock pages in my morning paper held maybe 50 kilobytes of data. The Swans have 470 million times more data than I had when I built my first system.
No wonder some of America’s top hedge funds have paid up to $750,000 a year for their data. Academics at Georgetown have studied their methods. And Harvard has cited their research.
These Triple-Digit Gains Got My Attention
I’m a numbers guy. Credentials are nice, but I trust results I can test.
So we ran a backtest to see what happens when the Swans’ data meets my Power Gauge.
Take coconut water maker Vita Coco (COCO)…
The Swans’ system would have spotted it 14 days before my Power Gauge turned “bullish.” Those 14 days could have turned a 469% gain into a 656% gain.
Or take SoundHound AI (SOUN), the company behind the software that takes phone orders at Chipotle and Krispy Kreme. The Swans’ system would have flagged the stock two years before mine did. That would have turned a 139% gain into a 756% gain.
Then we looked at every case where the two systems agreed. We found 432 of them. In 260, or about 6 out of 10, the stock went on to double or more at its peak.
Of course, no system wins every time. The real edge is a measurable, repeatable approach that works. And this one crossed that bar.
Why This Matters for You Now
In 1978, I lost a column of numbers and ended up with a repeatable edge.
Today, I’ve found a new set of numbers that promises to make that edge even sharper: the purchase intent of millions of Americans.
That’s why I was so excited to sit down with Andy and Landon for The Stock Tsunami Event last week.
We walked participants through how their data can alert you to a tsunami of buying on Wall Street… before it happens.
We also detailed what both of our systems are showing right now. And we passed on three free stock ideas as a thank you for attending: two urgent buys and one even more urgent sell.
I’ve changed my strategy before as the data changed. And it launched my career as a leading quant.
Now, I’m doing it again. And I can’t wait to show you the results.
Watch the replay here before it goes offline.
Marc Chaikin
Founder, Chaikin Analytics