The Volatility Mastery Blueprint
Roller coasters are not my thing.
It is something about not being in control of my body paired with the agonizing click-click-click of the track as I am pulled to skyscraping heights… I would much rather stay on the ground in the shade with some funnel cake and watch.
But I do understand the appeal.
Even the biggest thrill-seekers experience some level of apprehension – usually in the half-hour-long wait in line. But what keeps them coming back for adrenaline rush after adrenaline rush is knowing that they always get right back to solid ground afterward. They always know how it’s going to end.
Indeed, the starting point might be the most daunting part of any experience… but it’s not the most important part.
The same goes for trading.
We can buy stocks all we want; finding a stock that is a new leader in its industry, has strong fundamentals, or has a juicy dividend is not the hardest or most important part of trading.
What’s important – just like riding a roller coaster – is knowing how it ends… and that no matter the harrowing ride, you’ll find your feet on solid ground once more.
At TradeSmith, we created a proprietary signal that helps you figure out your exit plan: our Volatility Quotient (VQ%).
The VQ% allows you to quickly and easily identify the ideal price to exit a stock if its value goes south. It works like a proverbial parachute to help you avoid a serious loss.
I’m sure you already know the price I’m talking about: the trailing stop.
If you’re not sure what a trailing stop is, it’s a predetermined price at which you sell any stock you own. It’s a number that can always move up when a stock moves up, but it never goes down to help you lock in profits.
And though traditionally, investors have been advised to implement a 15-25% trailing stop for every trade in their portfolio, the truth is, sometimes 15-25% is not enough to account for a stock’s natural volatility patterns. And in some cases, it is too much.
At TradeSmith, we have been on the cutting edge of trading technology since our humble beginnings in 2005 – and our main goal is empowering, enriching, and educating our subscribers. The more you know, the better a trader you can be.
So, in this report, we’ll go over…
- The ins and outs of VQ%…
- Examples of high and low volatility quotients…
- And most importantly, where you can see all your investments’ VQ% numbers in one place.
Let’s dive in.
How the Volatility Quotient Works
The Volatility Quotient (VQ%) is determined by an intricate set of data points, with a focus on the previous three years of price data. The past year is more heavily weighted than the previous two years’ data.
From there, a unique percentage is calculated – from 5.00% to 95.00% (though either extreme is rare). This indicates how much of a trailing stop you should place on a given stock.
Here is a breakdown of the VQ% levels and a few example stocks in each, as of September 2025…
- Up to 15% = Low Risk
- Walmart (~14%), Coca-Cola (~12%), and McDonald’s (~13%)
- 15% – 30% = Medium Risk
- Oracle (~28%), Citigroup (~21%), and Apple (~20%)
- 30% – 50% = High Risk
- NVIDIA (~39%), Moderna (~45%), and Royal Caribbean (~32%)
- 50% and above = Sky-High Risk
- Wayfair (~62%), Super Micro Computer (~70%), and TG Therapeutics (~59%)
But before you let these sky-high readings scare you away…
Know that they do not mean the stocks are bad.
It simply means that they experience higher-than-average volatility – whether it’s their sector, black swan events, or other factors.
But higher VQ should not read like a giant, red stop sign…
Nor should it mean a blaring green “go” signal.
Rather, it implies that some serious consideration should be taken before diving headfirst into this stock.
Everyone has their own risk tolerance – a sort of “tortoise and the hare” dichotomy. Some folks prefer slow and steady growth stocks, while others prefer short-term trading. Most are a little bit of both.
It’s all at your pace… and the VQ% helps you figure out which stocks will help you achieve your financial goals.
Let’s dig a little deeper with a few stock examples.
A Tale of Two VQs
Before we dive in, please note: By the time you view this report, some of the stocks in these examples may have different VQ numbers. If any of these stocks interest you, be sure that you have the most recent VQ% data.
Say you entered Meta Platforms (META) on June 2, 2025.
Type in the ticker “META” in the top right search bar on the TradeSmith Finance home page and hit enter to initiate the search.

You’ll be brought to Meta’s asset page, where you’ll see the VQ% on the left, in addition to its Health Indicator reading and Trend.
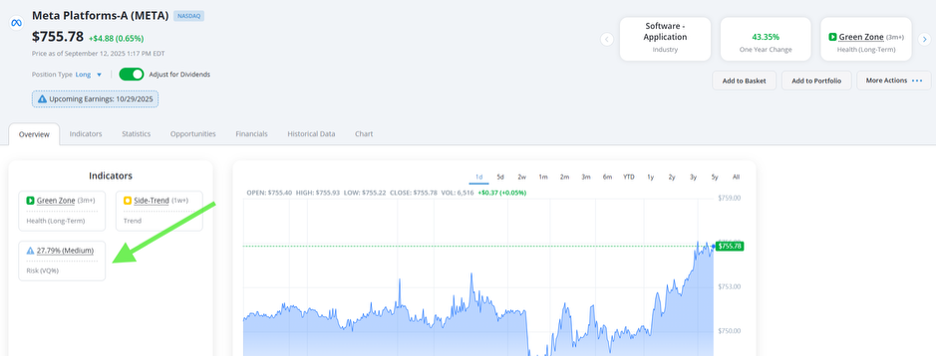
At the time this report was written, Meta had a medium-risk VQ of 27.79%.
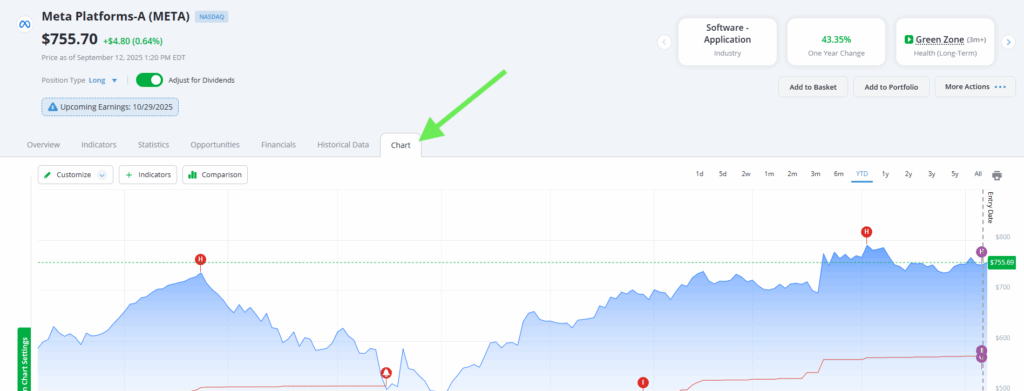
In order to calculate your trailing stop based on VQ%, you’ll navigate over to the “Chart” tab on Meta’s asset page.
There, you’ll see a vertical dotted line indicating the entry point. If you look to the left, you’ll see an “H” encircled in red. This indicates the most recent highest closing price for Meta, which is $790.00.
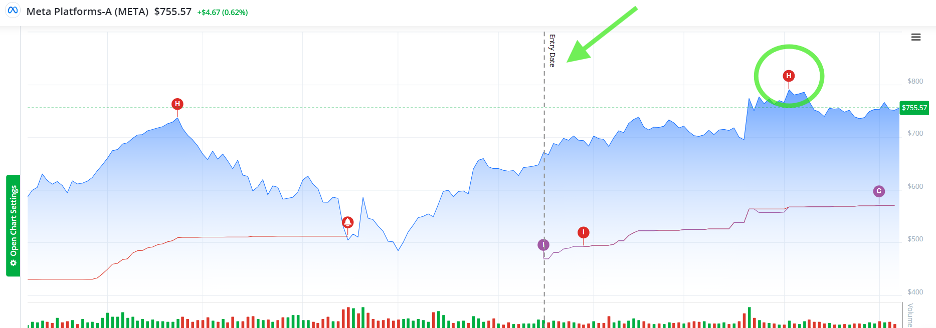
Here is how you’ll take these two numbers – 27.79% and $790.00 – and figure out your recommended trailing stop…
First, multiply the latest high close by the VQ%.
In this case, it’s $790.00 x (0.2779), which gives us $219.54.
Then, subtract that number from the latest high close. That will give you your recommended trailing stop.
This gives us $790.00 – $219.54 = $570.46.
On your brokerage website or app, you can set a limit order for a trailing stop on Meta at $570.46, so you can experience Meta’s natural volatility and not get booted out of the trade too early – or too late.
Let’s look at another example: Carvana (CVNA).
Say you entered this trade on March 4, 2025. As you can see below, Carvana carries a hefty VQ of 86.08%!
The stock is known for its high volatility, so it’s no wonder that the traditional 15-25% trailing stop will not cut it. A tighter trailing stop could cause you to miss out on some serious profit opportunities.
Using our formula from earlier, we’ll multiply the latest highest close price – which, in this case, is $390.17, by its 86.08% VQ.
This gives us $390.17 x 0.8608 = $335.86.
Then, we’ll subtract that amount from the most recent highest close price to get our stop-loss, so $390.17 – $335.86 = $54.31.
Yes, you read that right – a stop-loss of $54.31.
But again, that’s why we have labels on our VQ%. Carvana is an extremely volatile stock, and that should be taken into account before investing in it.
Now, just because Carvana has such a wide trailing stop, it does not mean that your other investments should follow suit. Carvana’s VQ% is not a one-size-fits-all number – it is custom for Carvana itself.
Now, to be clear, the beauty of our software is that you do not have to do any of this math on your own. You can set a VQ-based alert for any stock you own and be notified anytime the stock closes below its unique VQ risk point, and decide if you would like to close the position the next day.
And of course, you can also set a standing order with your broker to close at that price if you choose.
Applying VQ to Your Own Investments
As I mentioned earlier, we at TradeSmith take pride in our trading innovation.
Because while you are welcome to search each and every investment in your portfolio and log them elsewhere, you do have access to TradeSmith’s My Portfolios tool.
This handy platform can display all of your investments in an easy-to-review order, and you can change the criteria you’d like to display – including each asset’s VQ%.
And the fastest – and by far the easiest – way to set up your portfolios is by using our automatic syncing feature.
With all your information in one place, you can track all of your holdings – stocks, bonds, mutual funds, ETFs, options, commodities, and cryptocurrencies – without switching browser tabs or brokerage accounts.
To sync your brokerage account, simply go to the My Portfolios page, choose Manage, and then click Add Portfolio. It’s that easy!

Next, select the Link to Brokerage option, and click Continue to choose your broker. Our portfolio syncing features are handled through Yodlee FastLink – a secure-channel connection service trusted by banks and brokerages across the country.
While we use this service to pull data from your account and sync it with TradeSmith Finance, there’s no need to worry about your security. None of your personal account credentials will be saved to our servers.

Next, simply select your broker from our list – which features some of the most popular and well-known firms.
If you don’t see an icon for your broker, you can always search for your broker on this page by typing your broker’s name into the search bar at the top of the list.

If you can’t find your broker, we may be able to link it using our alternative data provider. Simply contact our customer support team at [email protected] for details.
Now, making adjustments to a synced portfolio on TradeSmith Finance will not place an order with your brokerage. So, you’re free to experiment and research without fear of accidentally placing a trade.
After selecting your broker, simply follow the prompts to complete your portfolio sync with your TradeStops account.
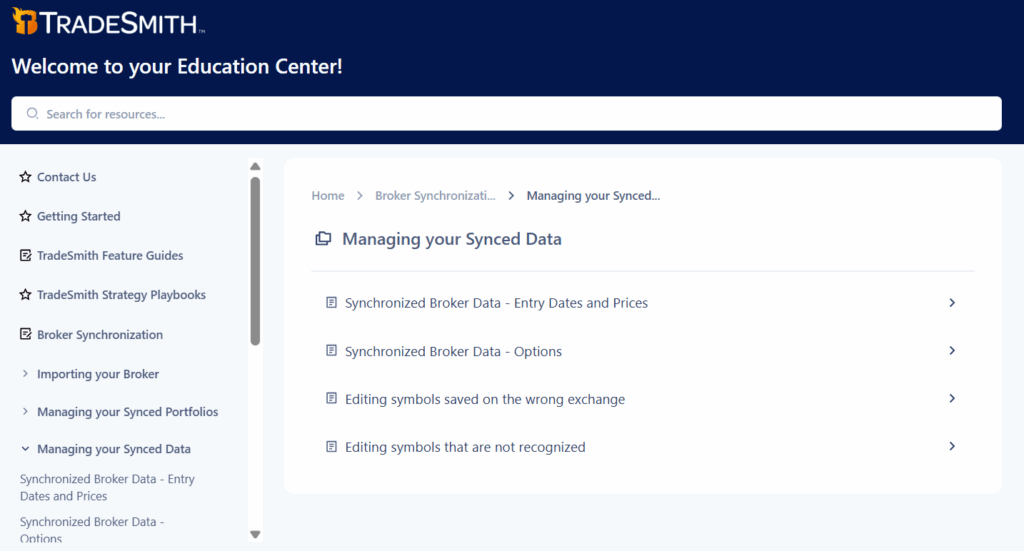
When you initially sync your broker account, we gather as much information as possible to track all of your investment positions in TradeSmith accurately. But if, for any reason, the information is not presented accurately on our platform, our Education Team put together a multi-tiered guide that covers troubleshooting, as you can see in the preview below. You can view this page here.
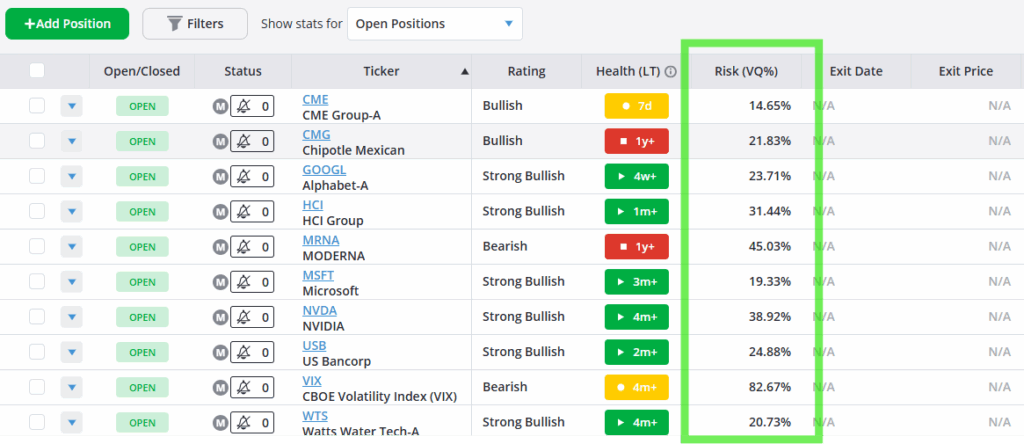
Once you’re synced, you can organize your positions by VQ%.
From here, you can add portfolio alerts for these VQ%-determined trailing stops.
These alerts will come as an email notification or push notification (if you’ve downloaded the TradeSmith app), and while the alerts will not take any action on your brokerage account, they’ll let you know that it is time to take action and protect your investments.
In Conclusion
As critical as it is to know when to exit a trade for a profit, it’s just as – if not more – important to know how to avoid a serious loss.
TradeSmith’s proprietary VQ% allows you to figure out the risk level of your investments and at which price you should consider exiting the stock.
This is just one of the amazing tools we’re so glad you have the chance to use here, and we know it will make you a stronger, smarter, and better trader.
Sincerely,
Keith Kaplan
CEO, TradeSmith
P.S. All investments carry risk. Remember, no matter the risk level of an asset, never invest more money in a trade than you can afford to lose.