This Buy Signal Is Undefeated Since 2008
By Lucas Downey, Contributing Editor, TradeSmith Daily
If your portfolio got slammed last week, you’re not alone.
The S&P 500 got steamrolled, dropping 3% and easily slicing through one of the most widely followed technical benchmarks: the 50-day moving average.
The reason? Most would point to surging interest rates. The U.S. 10-Year yield broke above 4.65%, a level last reached in November.
This has caused the bears to rally together, chanting the popular interest-rate scare mantra: higher for longer.
But here’s what the bears miss…
Last week’s pullback was one of the most destructive in a long while. And when you dive into the details of the selloff, you’ll find that the S&P 500 did something quite unusual.
The fund traded lower for six consecutive days… a feat that’s happened only a couple dozen times in the last 30 years.
Today we’re going to study history and find out what this can mean for stocks going forward.
There’s a good chance the findings will surprise you.
But first, let’s put this latest pullback into perspective.
The S&P 500 Finally Broke Trend
It’s been a while since stocks broke trend.
Looking at the 1-year chart of the S&P 500 ETF (SPY), you’ll note how last week was the first time in 2024 that we traded below the 50-day moving average:
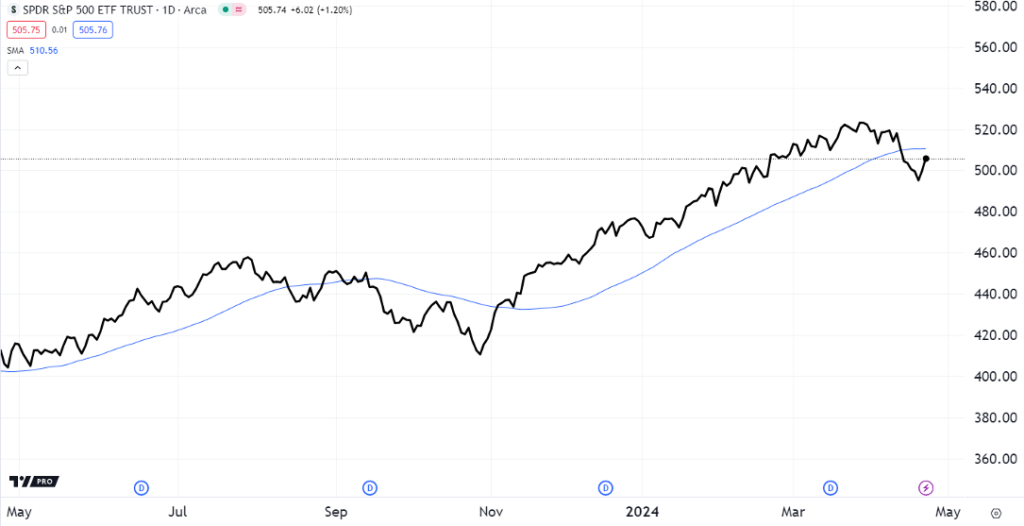
But trendlines only reveal part of the story. It’s easy to look above and worry that we could revisit the drawn-out decline like we saw from September through November.
However, this latest pullback is unique in that the market fell for six consecutive days.
Since 2020, this has only happened four times:
- Oct. 12, 2022
- Sept. 27, 2022
- And twice in late February 2020
Below I’ve circled each of these periods and added an arrow pointing to what came next:
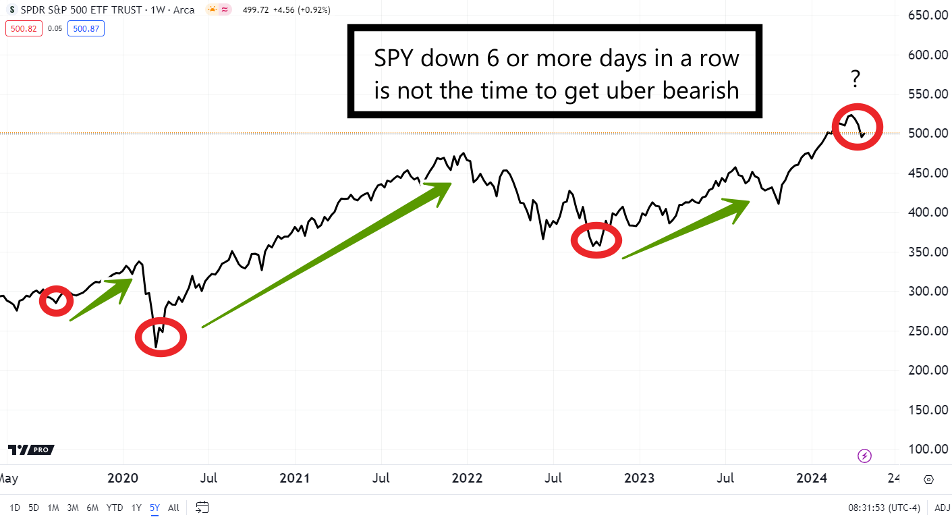
That’s a pattern, if you ask me!
The old-fashioned eyeball test tells me these multi-day drops are awesome times to go fishing for stocks.
But at TradeSmith, we don’t rely on our eyes alone for signals. We rely on evidence-rich data. And that brings us today’s study…
This Buy Signal is Undefeated Since 2008
Turns out, going back to 1993, we’ve had 26 instances where stocks fell six or more days in a row. (The record is eight days, which has only happened twice.)
Here’s the best part. These wicked drops tend to forecast gorgeous gains in the following months. Whenever the SPY is down six consecutive days:
- A month later, the index jumps 2.5% on average…
- Three months after, stocks rip 6.4%…
- Six months later, the S&P 500 flies 10.2%…
- 12 months later, it hands you a 16.6% gain.
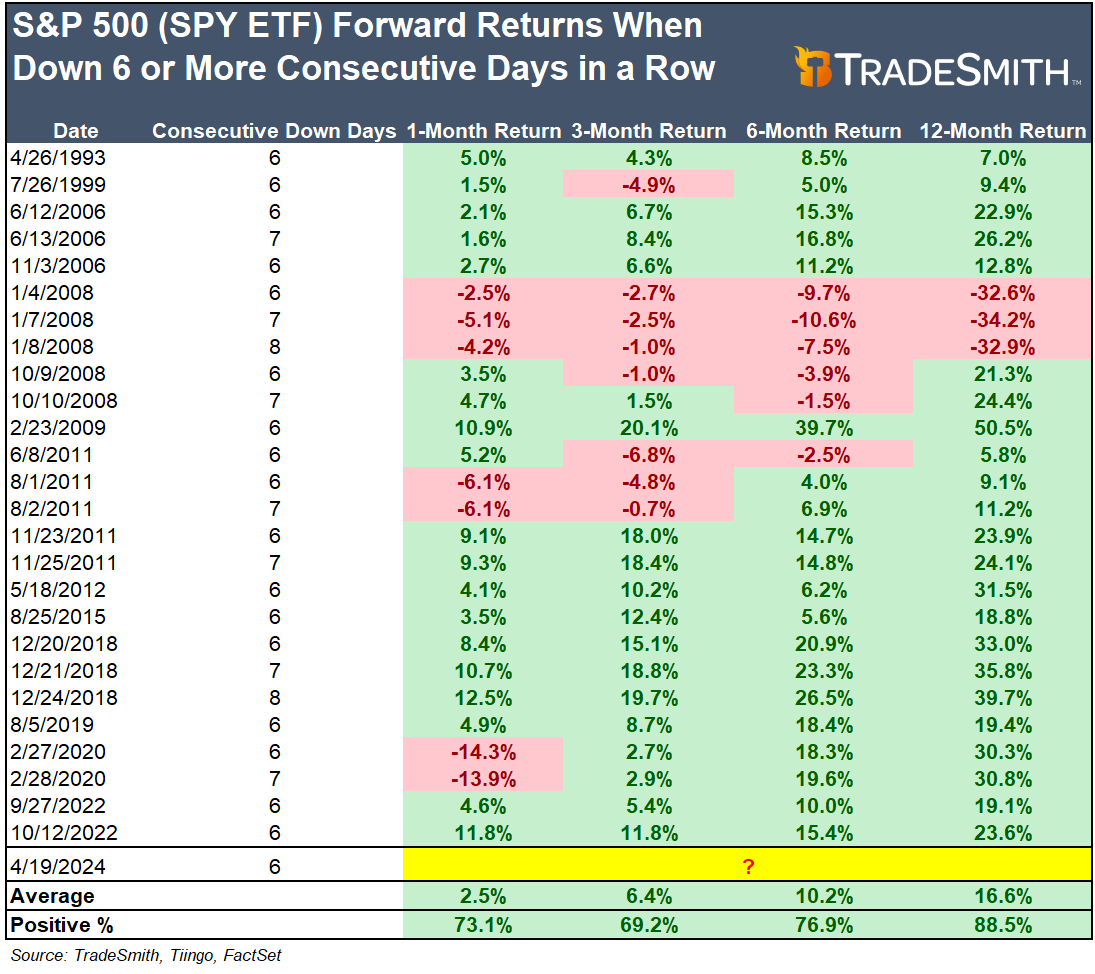
Folks, these are market-beating returns across the board. Annualized, all of these gains on all of these time frames beat the long-term market average of about 10%.
And only in 2008 did a signal like this come before long-term losses. Since then, this signal is undefeated.
I don’t know about you, but I’ll gladly take a six-day pullback for potential gains like these.
The takeaway here is simple: Stocks are your higher for longer play right now.
And the great news is this data echoes my latest buy-the-dip piece from Tuesday.
In it, I showed how the next few weeks could experience seasonal choppiness before a crowd-stunning rally resumes in about a month.
Embrace the dip.
Ride the rip.
A great setup is here.
Now it’s time for you to take advantage of it.
Regards,
Lucas Downey
Contributing Editor, TradeSmith Daily