Listen to the audio version of this article (generated by AI).
In This Digest:
- Missed our AI Signals Trading Event? Watch the replay
- A bullish setup for Nvidia that’s been right 20 trades in a row
- Rates are heading higher again, and one corner of the market is loving it
- Software glitches are becoming the norm – this company helps prevent them
A big thank you to folks who joined our Signals trading event this morning…
This past week, 11,703 of you signed up to join our CEO, Keith Kaplan, for our AI Signals Trading Event.
For those who attended this morning, thank you for spending your morning with us.
At the event Keith told the story of Jim Simons, the math genius who built the most profitable hedge fund in history by hunting for repeating “signals” in market data instead of reading headlines… and how we built a software system that picks up where Simons left off.
Keith also revealed the stock with the strongest bullish signal right now… and a popular stock it says to stay away from heading into Thanksgiving.
If you missed it, catch the replay here and hear both stock names for yourself.
Now, onto yesterday’s big news…
Nvidia’s first report without Jensen Huang was a huge beat…
For the first time in 33 years, chip designer Nvidia (NVDA) reported earnings without Jensen Huang running the company.
Huang resigned last Thursday amid a Chinese spy scandal. So last night, interim CEO Colette Kress had to answer the question on every investor’s mind: Is the AI boom still running without its biggest salesman?
The numbers say yes.
Revenue came in at $115.8 billion for the quarter ended Oct. 25. That’s more than double a year ago and well above the roughly $109 billion Wall Street expected. Sales to data centers – the AI chips that power ChatGPT, Claude, and the rest – hit $107.6 billion, up 110%.
And Nvidia expects even more next quarter: $130 billion. That’s without counting a single dollar of data center chip sales to China.
Investors liked what they heard. Nvidia opened Wednesday up 2.2% from Tuesday’s close, paring back a gain of as much as 5% overnight.
Wall Street spent the past week guessing what Huang’s exit would mean for Nvidia. Now, they’re guessing what the stock’s next move will be on the back of this big beat and raise.
Our Signals system doesn’t guess. It scans a stock’s trading history for combinations of factors that have come before moves higher – and flags them when they line up again.
And right now, one is firing on Nvidia.
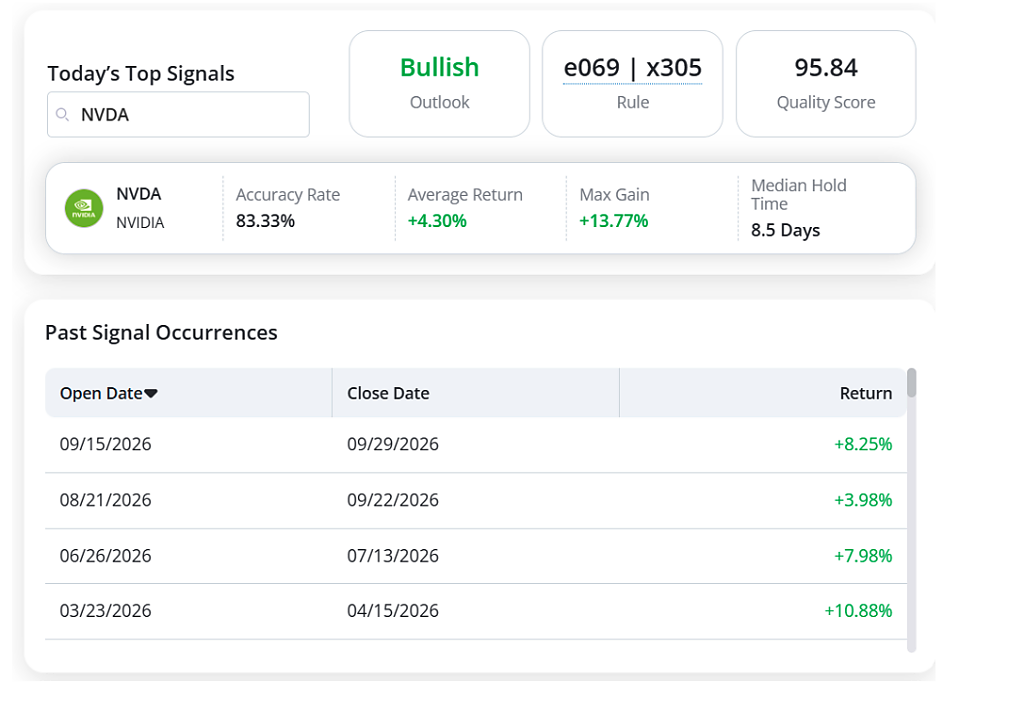
This is a Bullish Volatility Expansion signal. It fires when Nvidia closes lower four or more days in a row while the VIX – Wall Street’s “fear gauge” – is running above its 10-day average.
So it’s looking for moments when both the stock and the broader market are rattled at the same time.
Historically, those moments have been a good time to buy. This signal has been accurate 83.3% of the time, with an average return of 4.3% over a median hold of 8.5 days. Its best result was a 13.8% gain.
It’s fired 48 times over the past 10 years, six of them in the past year. And it’s on a 20-trade winning streak. The last time this signal ended in a loss was September 2022. Most recently, it fired on Sept. 15 and closed two weeks later, up 8.3%.
It also earns a Quality Score of 95.8. That comes from a second AI model that grades each signal against today’s broader market conditions. The higher the score, the stronger the setup.
To trade this, buy Nvidia and hold until you see an 8% gain or for the next 21 trading days, whichever comes first. Then close the trade and move on to the next signal.
Rates are climbing again – and insurers are getting a raise…
Amid the other market pressures we’ve been covering, now higher interest rates are back on the table.
On Nov. 10, Federal Reserve Governor Christopher Waller said a half-point rate hike “should be considered” if inflation ran hot – which it very much did. Today, Waller confirmed that a 50-point hike is likely imminent. “You have to go 50 in December to put it in place and get it done,” he said.
Futures traders went from pricing a 77% chance of a December rate hike to 91% in a week. And longer-term rates are climbing, too. The 10-year Treasury yield is now around 5.1%.
For most investors, that’s bad news. Higher rates tend to weigh on stocks because they increase the less risky income available in the bond market. And because of how Wall Street discounts future cash flows, higher rates also weigh on stock market valuations.
But one group of companies gets paid more when rates go up.
Insurers collect your premiums up front and pay out claims later – sometimes years later. In between, they invest that money in bonds. So when yields rise, insurers earn more on the same pile of cash.
Plus, insurers’ profits don’t hinge on how AI stocks trade. Nobody’s canceling their home or auto insurance policy because chip stocks sell off. That’s created a place for insurers to hide out in the recent tech rout.
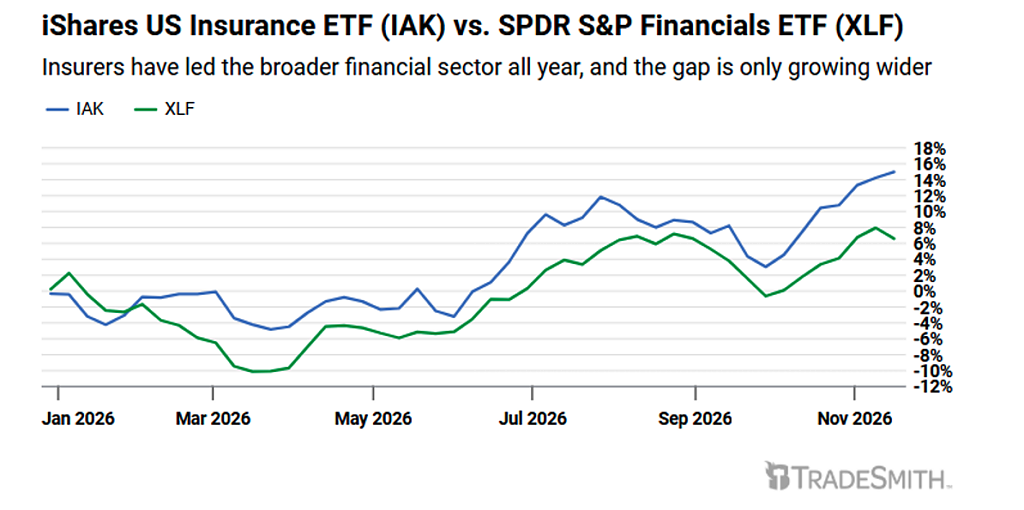
And we should note it’s insurers specifically – not the broader financial sector – doing the work.
Take a look at the chart below. Not only have insurers been a standout performer this year, doubling the return of the S&P 500 – they’ve also bested the broader financial sector handily. And the gap is widening:
Chubb (CB) is a good example of what’s driving that gap.
It’s one of the world’s largest property and casualty insurers, covering homes, cars, and businesses around the globe. And higher rates are already showing up in its results.
In the third quarter, Chubb’s investments earned a record $1.79 billion before taxes, up 8.6% from a year earlier.
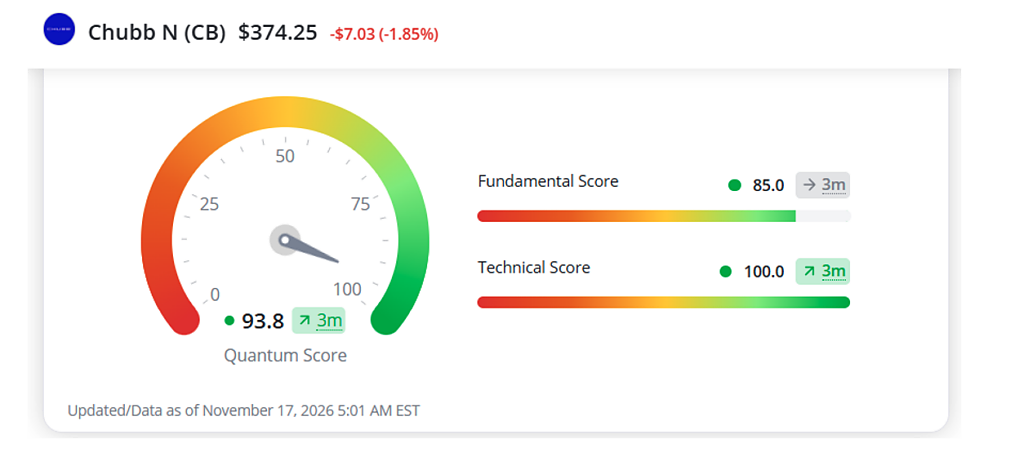
Big investors have noticed. Our Quantum Score gives Chubb a 93.8 out of 100. It rates stocks on two things: the strength of the business and how strongly big investors are buying. Anything above 75 is a buy.
Chubb’s Fundamental Score of 85 shows a strong, growing business. And its Technical Score is a perfect 100, which means buyers are firmly in control.
If rates keep climbing, you want to own the companies getting paid for it. Consider buying Chubb as a place to earn more while rates rise and tech stays jumpy.
Software broke all over America last week…
Last Thursday, Microsoft’s Outlook and Teams went down for about a day.
On Friday, the FAA halted departing flights nationwide – only the second nationwide ground stop since 9/11.
On Monday, United Airlines held its own flights during a systemwide tech outage, and customers of JPMorgan Chase couldn’t log in or move money. Customers at other banks, including Bank of America and Wells Fargo, saw delays on transactions involving Chase. On Tuesday, Apple’s iCloud, App Store and Apple Pay stumbled.
Even the NSA’s classified internal network went down.
Was this the work of a rogue AI? Who knows?
But Microsoft said it traced its outage to a software flaw introduced back in July. An FBI official linked Chase’s problems to a software release rolled out that Monday. And Apple blamed an internal update.
In other words, somebody changed the code… and something broke.
That happens more than you’d think. In a New Relic survey of 156 tech leaders at banks, insurers, and other financial firms, 34% said a software update gone wrong had caused one of their most damaging outages. Those outages cost financial firms $1.8 million an hour on average.
And the amount of code changing every day keeps growing. As I wrote yesterday, AI is writing more of the world’s software. Whoever – or whatever – writes it, more code shipped faster means more chances for something to break.
So companies need a watchdog. That’s what Datadog (DDOG) does.
Its software keeps watch over a company’s apps, servers, and cloud systems around the clock. When something starts going wrong, it alerts engineers and helps them track down the cause – ideally before customers ever notice.
Business is strong. In the third quarter, revenue climbed 35% to $1.20 billion. The number of customers paying Datadog at least $100,000 a year grew 20% to about 4,860.
Yet Wall Street sold the stock after that report on a cautious outlook for the current quarter. It now trades at $165.18, down 12% from the earnings report and more than 43% below its October all-time high.
The people using Datadog’s products see it differently.
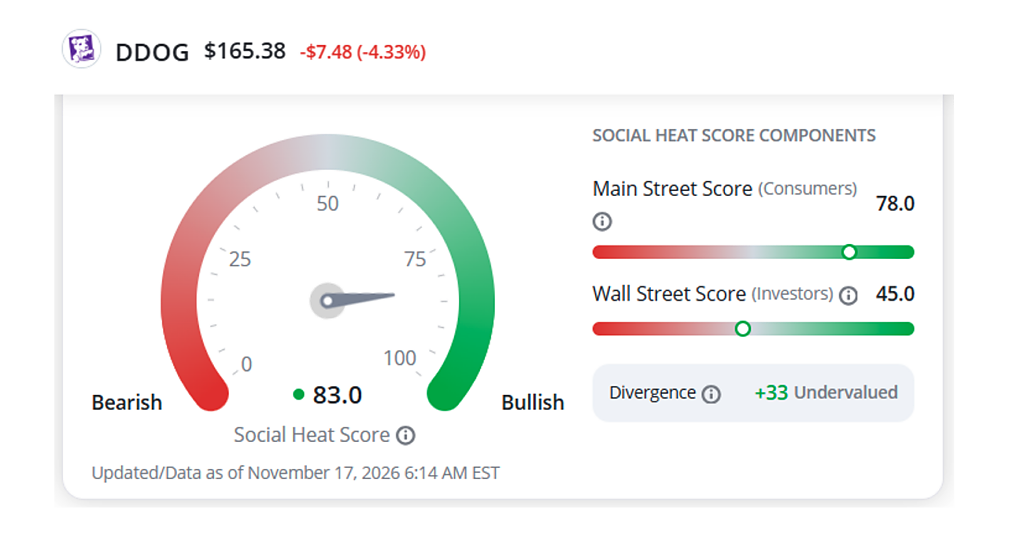
Andy and Landon Swan’s Social Heat Score tracks whether demand for a company’s products is building online – in search trends, web traffic, social media, and more – before it shows up in sales. Datadog scores 83.0 out of 100.
Note also how its Main Street Score, which measures that real-world demand, is 78.0. Its Wall Street Score, which reflects how investors and analysts see the company, is just 45.0. That 33-point gap is what the Swans call a Divergence – and our system flags Datadog as undervalued because of it.
So demand is building while Wall Street looks the other way. Consider buying Datadog before the numbers catch up. Every outage makes the case for the watchdog.
To building wealth beyond measure,
Michael Salvatore
Editor, TradeSmith Daily
Disclaimer: At the time of this writing, Michael Salvatore owned shares of NVDA.