A System to Wrangle Market Chaos
Markets were already on edge this week… And then came Thursday.
A nasty public clash between Tesla CEO Elon Musk and President Donald Trump wiped out over $150 billion in value from Tesla (TSLA) in a matter of hours. It dragged the S&P 500 down with it, fueling a -1.23% intraday swing lower.
Friday saw a reversal that took the S&P 500 to its highest level since February.
Up, down, all around – this kind of chaos is becoming the norm in 2025.
It might seem next to impossible to trade it.
But if you ask Jeff Clark, our newest expert joining us at TradeSmith, all you need is the right system.
Jeff’s been trading through market meltdowns for over 40 years. And while most investors panic during moments like Thursday, he’s shown time and again how to turn these moments into opportunities.
I recently sat down with Jeff to talk about how he’s managed to do this, using a rock-solid trading signal that spits out countless opportunities each day – to the upside and downside – all across the market.
Check it out below…
Once we partnered with Jeff here at TradeSmith, our priority was to backtest his top strategies and integrate the best ones into our software.
What we found was one strategy, involving a specific set of moving average lines, boasted a 10-year win rate of 72% on the long side and 69% for bearish setups. Over the last year, 21-day forward returns across both strategies averaged 5.85%.
Add the right option contract, and you have the recipe for continual double- and triple-digit short-term trades.
This Wednesday at 10 a.m. Eastern, Jeff will share the full details on how you can access this new system, and share 10 free ideas with all attendees.
For more details, and to sign up for this free event, click here now. And be sure to sign up for Jeff’s VIP service for access to his live trading blog from now through to the event.
To your health and wealth,

Michael Salvatore
Editor, TradeSmith Daily
Transcript
Michael Salvatore: Hey, everyone. Welcome back to TradeSmith Daily. It’s Tuesday, 9:07, just before the open. And, of course, I’m here with none other than master options trader, my good friend, and my longtime mentor, Mr. Jeff Clark. Jeff, how are you this fine morning?
Jeff Clark: I’m doing great, Michael. Thanks for having me on. I appreciate it.
Michael: It’s always good to talk, Jeff. It’s a really exciting time to be an investor. It’s a really exciting time to be an options trader. And it’s a really exciting time to be you and followers of your work. If you haven’t read TradeSmith Daily this week, I highly encourage you to go back and check out Wednesday’s piece where we talked a little bit about how Jeff has been absolutely cleaning up in this market. I think it’s something like 13 trades through the entire Liberation Day decline. And most of those were profitable. Almost all of them were at double digits. Some of them were close to doubles on your money.
To a lot of people, that might sound surprising, but it’s certainly not surprising to me. We’ve worked with each other for a long time. And not only that, you have this crazy knack for really, really, really crushing it during times when the market goes nuts. So what is it about when markets go nuts that makes you just such a great trader? How do you find these opportunities when everyone seems to be just running for the hills?
Jeff: Well, I appreciate those nice comments. First off – and not to jinx it, but I will tell you a little bit about this – when the markets are wild, when volatility spikes, my particular style of trading tends to benefit most from that because I utilize, I guess the best way to describe it is as a rubber band style of trading. Basically, what I’m looking for is for conditions to get either extremely overbought or extremely oversold where that proverbial rubber band is just stretched so far, it can’t stretch anymore. And then all I do is bet on a snapback, which is what rubber bands do. They expand and then they snap back. When you have an environment that is so riddled with fear or so riddled with greed, you get that volatility that creates very large expansions in the rubber band. And so it gives us many more opportunities to trade off of the snapback.
I mean, it exists in a normal market where you have ups and downs and everything else, but we’re in a chaotic market where a tweet from the president or any comment just off the cuff from Elon Musk can create movement in the market and can make emotions go crazy. That’s when we have opportunities. And so we’ve had an awful lot of opportunities since Liberation Day. You know, you mentioned 13 trades, there’s actually 18 trades that we’ve done. Sixteen were profitable. Three were triple digits. Most of the others were double digits. And it’s kind of an exciting time. Prior to that, though, I’ll tell you January and February, I didn’t do a lot of trading. Maybe we had two trades a month back then because you didn’t have that sort of volatility. But since February, we’ve seen this remarkable volatility, and it’s really given us a lot of opportunities.
Michael: Well, that patience is such an important part of being a trader. And you’ve always taught me, don’t trade just to trade. Don’t trade just because you feel like you have to do something. If you just sit at the screen and watch the market and nothing presents itself, then that’s what you did that day. And it can be frustrating, but that patience and that willpower is really important.
But let’s just talk a little bit more broadly. Our readers, like everyone, are clearly worried about where the markets are heading next. Things really got topsy-turvy this year. So let’s just go down a short list of what’s been going on.
We have this new tax bill, which people are rightly looking at as a massive liquidity injection into the financial markets. We saw this big recovery, but the tariffs are obviously still a big question mark. We don’t know if we’re going to compromise. We don’t know if they’re going to go away entirely. We saw some weak jobs data early on, and we’re still waiting on the Friday jobs data. There’s just so many forces tugging in all kinds of different directions. So, you know, on this zoomed-out level, what are you looking at that can shape the second half of this year that investors and traders should really be watching?
Jeff: Well, all of the things you point to, they exist all the time. The conditions might be a little bit different. Like, we don’t always deal with a trade war, but we always have something that the market can obsess about and can worry over. So the ability to step back from that is really important. And it’s also important to understand that even though the conditions are different, people’s emotions aren’t different, right? People still react the same way. They still panic sell, they still panic buy for fear of missing out. So what we try to do is capitalize on that. It’s not necessarily pinpointing what’s going to cause that move, but to recognize when you reach levels in that rubber band where things have gone too far in one direction or the other and recognize the indicators that oftentimes point to a reversal. And that’s kind of what I think I do pretty well is I have a very good gauge of the emotion of the market when people are getting too panicked to the downside or too exuberant to the upside. And then just using that information to bet against it.
The one element I do think is the larger backdrop to this market that I think folks are maybe not paying quite as close attention as they should be is the structure of interest rates right now. As you know, Michael, for the past two years, up until about January of this year, we had an inverted yield curve. And what that really means is basically short-term rates were higher than long-term rates. That’s not supposed to happen, right? You go to your bank, you say, I want to tie up my money in a 30-year CD. You expect to get paid a little bit more than if you tied it up in three months. So long-term rates are supposed to be higher than short-term rates. That inverted a little over two years ago, and it stayed inverted for a very long time.
Now, folks, if you’re listening to this, you might remember two years ago when this first happened, everybody was wigging out about it. Right? You had all the folks on CNBC and Fox Business and Bloomberg all talking about how an inverted yield curve is usually a precursor to a recession. And that’s what the economic textbooks all tell us. Yield curve inverts, it’s a really good signal that there’s probably a recession coming down the line. What it doesn’t tell you is in the real world, what happens is not a recession while the yield curve is inverted. It’s the chaos and the recession that occurs once the yield curve goes from an inverted state back to a normal slope state, an upward sloping yield curve. That just happened in January.
So I’m on alert for economic chaos, recession-type things, and chaos in the stock market. This is only the fifth time in my adult lifetime it’s happened. 1992 was one. 2001. 2007, which led to 2008. And then right before the COVID disaster back in January of 2020, you had an inverted curve go back into an upward slope. And now we’ve just done it again. So the four periods I just mentioned were all followed by a rough stock market and a rough economy. I have every reason to believe that this period will be followed by a rough stock market and a rough economy.
But I don’t see that as being a bad thing, right? We’ve often talked about this off camera that anybody can make money in a bull market. All you have to do is buy and sit and you’ll do just fine. The tide lifts all boats. But it’s decisions that you make in a bear market that can make you wealthy. And that’s a big difference. A lot of folks are afraid of a bear market. But if you think about it, go back to 2008, when was the best time in this century to buy stocks? It’s at the bottom of a bear market. That’s the opportunity I’m hoping to see as we get through 2025 and early 2026. I think we will have that opportunity to buy stocks at generational lows. And it’s not something you see that often. And I’m kind of looking forward to it.
Now, oftentimes when I talk about that, people go, “You’re just a perma-bear, and you’re talking bearish to scare people.” I’m not talking like that at all. I’m excited about the possibility of being able to put money to work at significantly lower stock prices. And in order to do that, you have to have cash. So here we are sitting near all-time highs on the S&P 500, near all-time highs on the Nasdaq, near all-time highs on the Dow. If you’re fully loaded, if you’re 100% in and you’re 100% on margin, it’s probably not a bad idea to peel some back. Take some money off the table, and that way you have some cash available when prices come back down. And if you were sitting there at the bottom of the market in April and you had your head in your hands and you’re just crying about the fact that you had a chance to sell but you never did, and now, “My God, I’m losing so much money”… If that’s what you went through in early April, things have recovered, so don’t go through it again. Take a little off, put it aside, and be ready to pounce when the market gives us that opportunity.
Michael: Absolutely, Jeff. I’ve always called you the zen trader for this exact sort of perspective that you have on markets. You warn people about what could happen, not because you have any sort of agenda, but because the data is simply what it is. And you’re also not upset. You’re not angry. You’re excited about these opportunities. And we should really just kind of emphasize the gravity of the potential of this opportunity. This wasn’t just a yield curve inversion. This was the longest and steepest yield curve inversion ever, if I’m not mistaken. And it’s also coinciding with the end of a decades-long bond bull market, which is another part of that you’ve been talking about a lot lately. So there’s a high chance for chaos in the second half of this year.
But now I want to zoom back in. I know you have a pretty much religious chart review every week. You’re always looking at charts, andwhat people should understand from this conversation is all of these things we talk about manifest in charts and in technical indicators. And these are the things that signal you to trades. So, Jeff, do you have any charts you can show us right now of really exciting setups?
Jeff: Yeah, I do. I mean, I had a lot more previously before the market had this big ramp up, and I had a lot more when we had the rally in February that led to the decline, but I do have a handful. So let me see if I can share my screen and give you an idea of some of the things I’m looking at. We’ll start with some potentially bullish setups. Let’s see what I’ve got here.
OK, so over on the bull camp, one of the worst-performing sectors in the market right now is health care. And part of that is because of the cutbacks in government spending, and this Big Beautiful Bill that’s working its way through Congress has a fairly significant cutback in health care spending. That has hit a lot of the health care providers. So you have Humana, which is what this chart is. You have UnitedHealth, a handful of others that are all trading closer to their lows for the year than they are to their highs. And you can see with this chart of Humana –and most of the stocks in the health care sector look similar to this – where the stock literally just made a new low last week. So it’s down significantly from where it was.
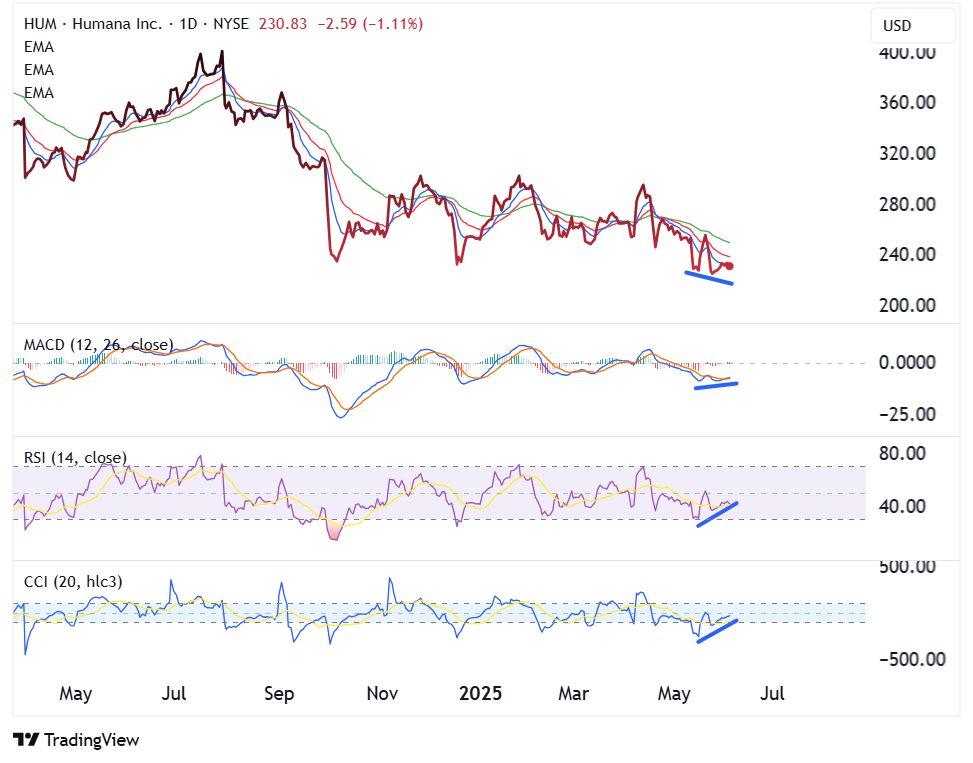
But if you look at the fundamentals to this, Humana trades at about 14 times earnings. Normally it trades closer to 20 times earnings. It trades about 0.3 times sales, and normally it trades at double that. It trades at 1.4 times book value, and typically it trades closer to 3 times book value. So this is a fundamentally cheap stock, but you don’t buy stocks just because they’re fundamentally cheap. They have to have a positive technical setup.
Now, one thing to comment on here, Michael, is when you look at charts, you know, a lot of folks kind of ignore technical analysis because it’s like reading tea leaves or staring into a crystal ball or something along those lines, and it doesn’t make a whole lot of sense to them.But if you look at charts as an emotion or a magnification of the emotion behind the stock at that given point, this will tell you when folks are getting too excited or they’re getting too panicked. And that’s really all a chart is – it shows you basically how the emotion is around the stock at this particular point in time. And if you look at Humana – and again, this applies to most of the stocks in the health care space – you’ll find that it’s trading well below all of its various moving averages.And these various moving averages are expanded quite far from each other. If you look back at history, you can find that typically when the stock gets this far below its moving averages, and then when you get these expansions, that means the stock is very, very close to the bottom. Same is true on the upside. If the stock was trading much higher than its moving averages and they were expanded to the upside, we could say we’re looking at a potential top.
So this hits my radar because of the historicdistance between the moving averages and the shape of the moving averages. Below it, I have various technical indicators. And these, not to get into the weeds on it, but they’re just basically momentum indicators. They tell me how strong a current trend happens to be. And in this situation, we see Humana is making lower lows. But when you look at the momentum indicators, you can see that they’re actually making higher lows. That’s a warning sign. That’s a warning sign of an impending rally, if you will. So this is what we call positive divergence, meaning the stock’s falling but these momentum indicators are actually rising. So as the stock is falling, the downside momentum is lessening, the momentum picture is improving. And like I said, this is typically what you see prior to a change in trend.
So I think at the very least these health care stocks are very close to their lows. They might not be at the absolute bottom. Maybe the stock has to come back down one more time and create even stronger positive divergence on these indicators. Or maybe it just starts to move higher from here. But these are definitely ones that I will watch and see if I do actually get a buying opportunity in them.
Now, if you reverse that and you look for stocks that are overbought, let me give you an example of a stock that I actually enjoy shorting, which is Bank of America. So here’s a good example. And we could walk through multiple situations on this stock whereyou have it expanded far away from its moving averages, in this case far above. And bank stocks have typically traded about 1 times book value. So this is a really easy way to understand bank stocks. Outside of JPMorgan Chase, which always trades at a premium because it’s one of the country’s best, and one of the best-run banks in the world, everybody else typically trades around 1 times book value. So when you wind up in a situation where the banks are trading at 1.2 times book value or above, it’s usually a pretty good opportunity to short.If they’re trading at 0.8 or below, it’s usually a pretty good discount, which gives you an opportunity to buy. That’s a broad-based rule.
So fundamentally, Bank of America is a little bit overpriced. You can look at Capital One, you can look at Chase, you can look at Wells Fargo. Most of the banking sector is overbought fundamentally, which shouldn’t be a surprise since the entire broad stock market, the S&P 500, trades at 23 times earnings. That seems like a pretty expensive characteristic on its own.So most of the other stocks are going to trade at relatively expensive valuations compared to history. This tells you fundamentally things are a little bit overbought. But when you look at the chart, you can see how Bank of America is this wonderful rally off the bottom.

One thing to point out is at the bottom, I was actually buying stocks on Liberation Day back here. One of the best trades we made was in Citigroup, and it was simply because you had a situation where the stocks were discounted fundamentally and they were expanded very far away from moving averages and you had technical conditions that justified a bounce. Now I’m taking the other side of that trade because we’ve had this amazing bounce. Bank of America got down to $30, now it’s trading at $45, so it’s up 50% in six weeks. It’s a pretty good move, not too far from its all-time high. Now, it’s a little bit expensive, and if you look at the momentum indicators at the bottom of the chart, you can see we’ve got a negative divergence. So as the stock is making higher highs, the momentum indicators are making lower highs. So this negative divergence tells us that we are quite possibly nearing a reversal point.
So those are just two of the sectors that I’m looking at.And I mean, if we were to go one by one through them, you’re going to find a lot more situations right now that are overbought than oversold, obviously, because we’ve had such a big run up. So my portfolio is leaning a little more on the short side than it is on the long side. Does all that make sense?
Michael: It makes perfect sense. I mean, when you see bullish setups in health care, a very defensive sector, and you see bearish setups in finance, a little bit more of a risk-on sector, it really does coincide with a potentially risk-off attitude heading into June. And June is actually historically one of the poorer-performing months for the stock market in general. So I completely agree with the high probability of seasonal volatility this month.
And speaking of volatility, as I mentioned before, you are the master of volatility. We’re seeing it firsthand right now. But I have a quote. A lot of folks watching this probably know the name Porter Stansberry. Back in the day, I used to work at Stansberry Research. But this is one of my favorite quotes that really encapsulates what you’re all about. Porter says, “Jeff’s trading this year was nothing short of heroic. Fifty-two recommendations, all of them short-term trades. Out of these, 42 made money. That’s a win rate of more than 80% in options trading.” And Porter’s right to say that’s ridiculous. The average return was 31%. That’s outrageous when you understand how quick these trades are. And the cumulative total return was greater than 1,700%. A little paraphrasing there, I’m sure Porter will forgive it. But my favorite thing about this quote is when Porter said it, Jeff, this was in January of 2009. He was referring to 2008, one of the worst years for the stock market over the past several decades. So you’ve already told us how you stay ahead of these major swings, but this evidence should tell everyone out there just how capable Jeff is in environments like we’re potentially about to be in right now.
Jeff: Well, yeah, and if I could interrupt, the great thing about 2008, we already said it’s wonderful when you’re able to buy stocks at incredibly cheap prices. It’s oftentimes people would look at a track record like that and go, “Well, yeah, you made money shorting the market and you’re a perma-bear anyway, so that makes sense.” But most of the trades I did in 2008 were actually buying stocks and buying options betting on the upside of those stocks. So really all I did in 2008 was that rubber band again. I waited for conditions to get incredibly oversold – and we had many of those opportunities back then – and then play the bounce. And in bear markets, you get some of the wickedest bounces that you can imagine. That’s why I look back at this bounce that we’ve seen over the last six weeks and I think, gosh, this is a typical bounce in a bear market. This is a typical counter-trend rally. I mean, when is the last time we saw a rally of this particular nature?
Shortly after Liberation Day, the market went up 9% in two days. That only happens in bear markets. That only happens from deeply oversold conditions, which is what we had in early April. So that’s what I think is on tap as we go forward in 2025. We’ll probably have situations not unlike what we saw in April where you get significantly oversold conditions where that rubber band is snapped back and it can launch a rally like this. That’s what happened in 2008, and I expect it’s going to happen again. And if it doesn’t, I’m OK with that too, because I’ll still just keep playing the rubber band for whatever it gives me. But I’m looking forward to the opportunity of buying at significant discounts.
Michael: Yeah, that versatility is so important. Everyone watching this should know that, you know, Jeff does not have all his eggs in the bearish basket at all times. He is selectively choosing when to trade. He does not need a bear market. He does not need a bull market. What he needs is a great setup, and he knows how to find those.
So, Jeff, you just joined the TradeSmith family. I’m incredibly proud and happy about it. It’s funny how things come together. You know, we met eight years ago in a very different place. Butyou’re here now. And one of my favorite things about what we started all that time ago was your trading blog, Delta Direct. And for those who don’t know, this is essentially like a mini Twitter that’s only Jeff. That’s the best way to describe it. Jeff will write several short updates throughout the day. He will deliver trade setups. He will deliver explicit trade recommendations and his own analysis on the market. And to celebrate you joining TradeSmith, we’re makingthis very, very valuable resource – through which, I should emphasize, most of those trades from the Liberation Day crash came from – available for the next several days for anyone who is interested. So, Jeff, can you tell us a little bit more about how people can get access to that?
Jeff: Sure. Well, next Wednesday the 11th, at 10 a.m. Eastern time, I’m holding a webinar talking about how I think it’s going to be best to trade this market throughout the rest of this year. We’ll talk about that whole rubber band trading strategy. We’ll talk about volatility. We’ll talk about some of the ways that I specialize in trading and what I see coming down the pike. And if you sign up for that webinar and you join us as a VIP, you’ll have access to Delta Direct for free up until the webinar date, which gives you several days of my commentary.
And you said it’s kind of like my own personal Twitter. It’s more like my own personal Truth Social. So you’ve got President Trump’s, and then you’ve got mine way, way, way down at the bottom. But I think mine is probably equally as useful as following the president’s. And it’s my market commentary. I comment at least once a day. And most of the time it’s more like three or four times a day.I comment on where I think the market’s going to head in the very, very short term, meaning that particular day, also with a weekly or a monthly view going forward. And then anything that catches my eye, anything that’s curious. It’s sort of like, you know, I sit down in front of the computer all day, I’m watching the stock market the entire day, and I’m just sort of sharing some of the observations that I see occurring in the market and what has me leaning bullish or leaning bearish depending on whatever the characteristics are out there.
And I try to explain that. It’s educational. But then there’s also opportunities where I will throw a trade out there. Usually we do one or two trades a week in this particular service. Sometimes we get opportunities to do more. Sometimes we exercise our patience a little bit more. In this particular environment, we’ve been pretty active. And you’ll have access to that. You’ll get all of that stuff. You’ll get all the commentary and the trade recommendations up until the webinar.
Michael: Yeah, it’s a very valuable resource. I highly encourage everyone to sign up if you haven’t already. Just to be clear, you go to the website where Jeff’s going to be doing his webinar and then you just type in your phone number and Jeff will deliver those blog posts directly to your phone for you to check out. And I highly, again, suggest you do because there are some very valuable setups in there as we’ve demonstrated today.
But that’s actually not all we’re doing. Jeff, as you’ve come to understand, TradeSmith is a bit of a technical powerhouse. We’re not just a newsletter publisher, we’re also a software platform. And so what you’ve been able to do is take your trading strategy and turn it into something very special for TradeSmith subscribers specifically. Now, I don’t want to go too much into this because we’re saving it for the big event next week. But what can you tell us about what you’re preparing? I know it has something to do with a couple of the charts you just showed us, actually.
Jeff: Well, you know, Keith Kaplan and I have known each other for quite a while. Keith is the CEO of TradeSmith, and we got together many, many years ago and talked about possibly some sort of collaboration between the technology that he does and the legwork that I do going through the charts. And we were just never able to come to arrangements. The timing was never quite perfect. And it turns out that the timing became perfect right as all of this is hitting the fan this particular year.
A few months ago, Keith said to me, you know, “I can make your life easier.” And, of course, I always endeavor to become friends with people who are willing to do that. And so he said, “Just tell me how you pick stocks, what it is you’re looking for, and we’ll create a system behind it.” And my comment to him was, “I don’t trust systems. Systems don’t adapt to the market. Whereas when I look at a chart, I’ll notice things that are different today than they were before. So the patterns that I’ll trade off of have to evolve along with the market. So oversold conditions three years ago aren’t the same as oversold conditions today because the market has evolved, and you have to adapt to that, and most systems don’t do that.”
So I described to him how every Saturday morning I go through thousands of charts, 1,500 to 2,000 charts, and it’s just a time-consuming process. It’s just a lot of leg work, and it takes hours to do this. But I’m looking for specific setups or things that look interesting to me. So when I described those, Keith said, “I think we can put a system together that will make your life easier.” And so they came up with it, the folks at TradeSmith, the tech geniuses there, and they put it together using the parameters that I look for, and they put together a screen that spits out to me every day somewhere around the range of 50 to 100 different potential trade candidates. Some of them are bullish, some of them are bearish.
It’s essentially all the legwork that I would normally do one by one, taking me hours. And now it’s just all right there, boom. It makes things much more efficient. It gives me a lot more opportunities to try to focus my attention on specific setups that I’m looking for. And that’s what TradeSmith has done for me. And we’re going to unveil that during the webinar. So I’m not going to say anything more about it because it is a very exciting development and we’re going to make it available for subscribers.
Michael: Yes, that’s the most exciting thing for me because I’ve been seeing this report in my inbox, fortunately, as an employee of TradeSmith. And it is so valuable because, Jeff, I worked with you for so long, I look for these setups myself now. I write about them in TradeSmith Daily. And now I get to just filter down this very specific kind of setup, and it leads me to such interesting things to write about. So it’s like a match made in heaven. Your work, our work. And I’m really excited about it. Everything’s coming together.
So we’re going to wrap it up there. The market opened four minutes ago. I know we’ve all got a lot to get to today. Jeff, thank you so much for talking to me today. It’s always a pleasure.
Jeff: Thank you, Michael, I appreciate it.
Michael: All right, thanks everyone. We’ll see you on Monday.