Bearish Fearmongering Has My “Contrarian Alarm Bells” Going Off
Listen to the audio version of this article (generated by AI).
Editor’s note: When everyone’s bracing for the same disaster, we start looking the other way.
Today, you’ll hear from William McCanless, senior analyst at Trade Cycles. William studies seasonality: the recurring patterns in how stocks behave at certain times of the year and month, right down to specific trading days.
That last part led to his latest research, a strategy built around the ninth trading day of each month. It’s a five-stock portfolio that trades once a month, with no options and no leverage. William will have more on it for paid-up subscribers in early November.
First, though, he’s got a contrarian take on the bond panic dominating the headlines…
Historically, October has been a bullish month for stocks. But you’d never know that from reading the headlines.
Instead, there’s been a lot of hullabaloo about the bond market. The idea is that bond prices are going to keep dropping, which would mean interest rates keep spiking.
The Economist magazine did a whole cover story last week about “Will bonds blow up?”
There was even more fearmongering on Reddit and X, where some traders said it was going to cause an outright default on U.S. debt… or that the United States was going to go into hyperinflation.
Others were worried about mortgages, car loans, and credit cards getting more expensive and that an overall “doom loop” was imminent.
And I’m not saying those things aren’t distinct possibilities, if history is any guide.
The question is whether this is something serious to worry about right now.
But when a narrative like that makes its way to the cover of a publication like The Economist, then all the little “contrarian alarm bells” start going off in my head.
Because by the time it reaches the cover of a major publication, most of the people who were going to sell… have sold.
And That Usually Means the Worst of It Is Over
In fact, the “Magazine Cover Indicator” is a pretty well-known signal that the whole situation is about to reverse.
Traders and investors have been using it since at least the 1970s.
One of the most famous examples was “The Death of Equities” in 1979 on the cover of BusinessWeek.
BusinessWeek reported that inflation was high, stocks had gone nowhere for 10 years, and at least 7 million people had given up on stocks since 1970.
The best part is that this 1979 article claimed the equity slump was a “near-permanent condition” and quoted an executive calling stockholders “old fogies.”
Was it, though? As you can see below, the S&P 500 has done just fine since then:
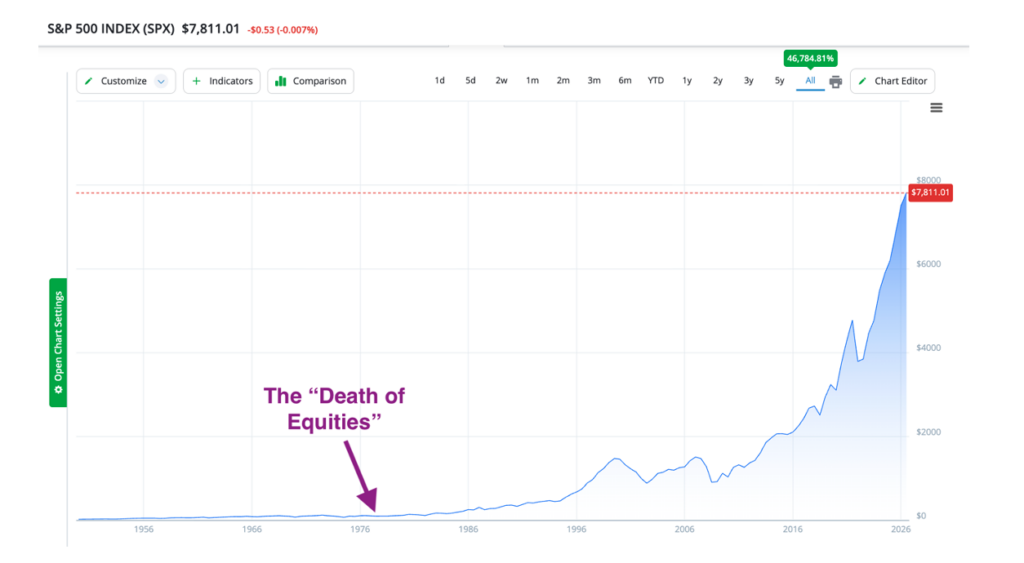
In fact, the 1980s saw the start of the biggest bull market in modern history. The S&P 500’s average return was close to 20% a year for 18 years, for a total return of 2,500%.
That’s one famous example… but there are plenty from just the last few years.
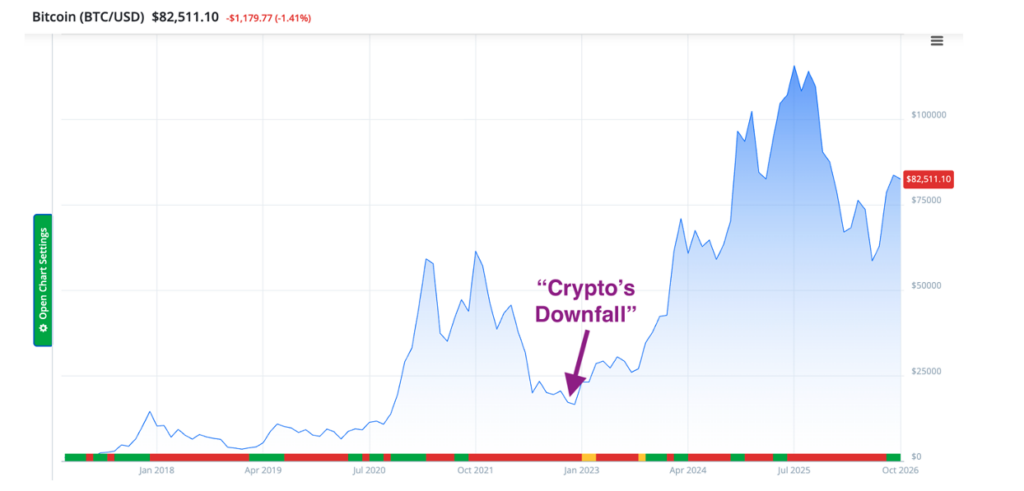
November 2022 was supposed to be “Crypto’s Downfall.”
Within days of THAT Economist cover story, Bitcoin bottomed at $15,500 and is now up over 400%:
These are just a couple of examples, but honestly, I could go on and on.
One that I distinctly remember from September/October 2022 was BusinessWeek saying that there was “no end in sight” to the dollar’s rise.
And during that time, I was actively telling my subscribers the SAME thing I’m telling you now:
October is bullish.
Except it was even harder to believe at that time.
From May 2021 to September 2022, the U.S. Dollar Index (DXY) rallied about 28%, and the S&P 500 was down nearly 20% over a similar timeframe.
With the snap of a finger, DXY broke down and dropped over 10% by January:
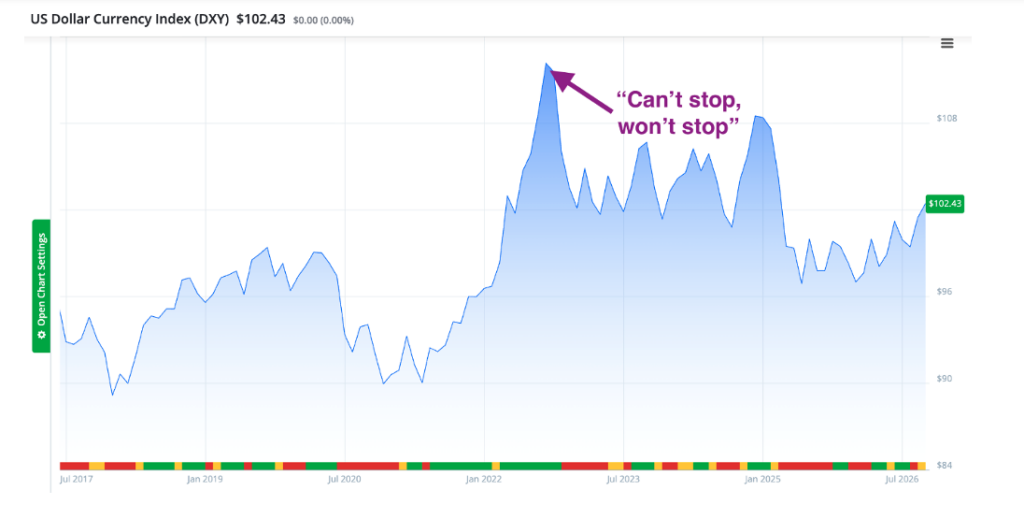
And the S&P 500 began to rally like crazy.
Yep – by the time this bearish cover story came out in 2022, the “October turnaround” hit within days.
How Did I Know? I Had the Right Seasonality Data
Now it’s October again… and just as the month began, I had someone tell me:
“You shouldn’t tell subscribers that October is likely to be a turnaround, because the WORST crashes always happen in October!”
I’ve actually heard this a few times. And the reputation comes from two big, scary events.
- The 1929 crash – Black Thursday (Oct. 24), Black Monday (Oct. 28), and Black Tuesday (Oct. 29)
- Black Monday (Oct. 19, 1987)
After that, though, the market reversed higher.
There were other notable episodes — October 2008 was hardly a great time for stocks.
And I’m not going to discount the possibility that we’ll still see turmoil into the end of October.
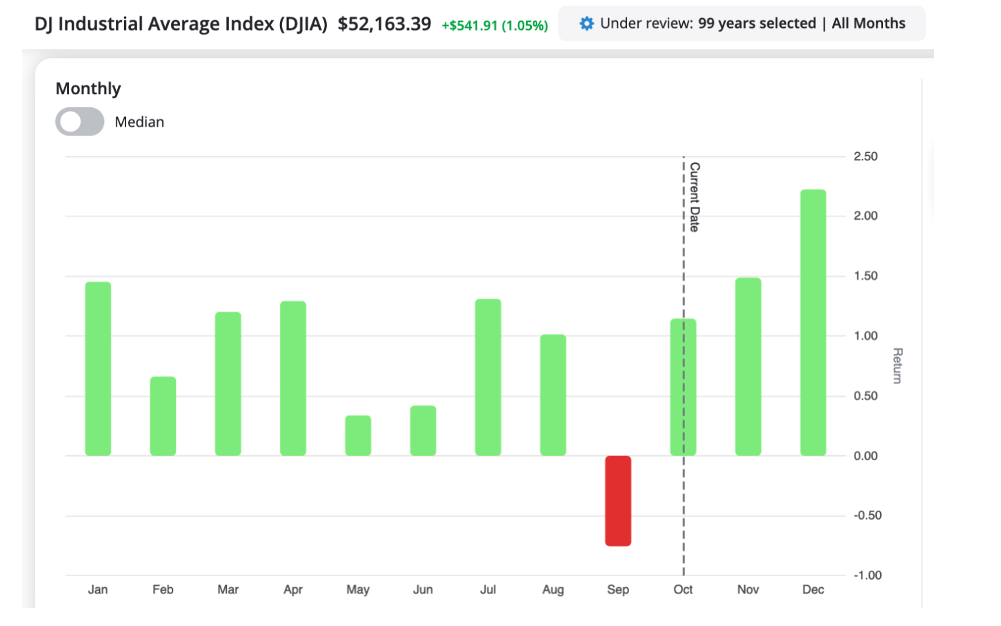
What you do need to know, though, is that even when you factor in the data from a century’s worth of stock prices…
October is still positive on average – with even better returns in November and December:
The other market indexes show an October turnaround, too:
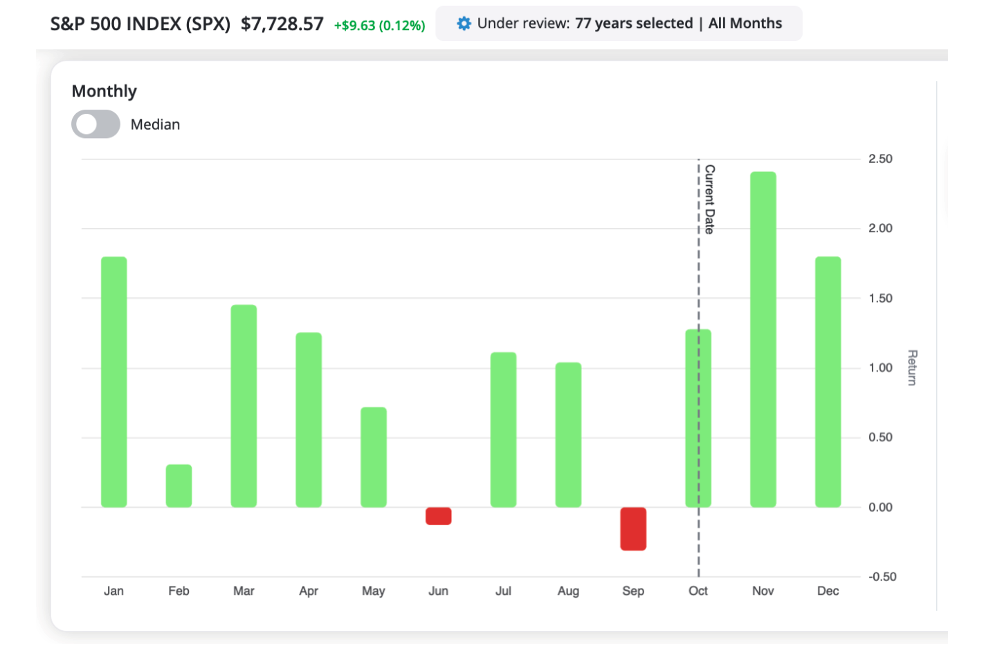
That’s from our Trade Cycles seasonality tools – and when I switch over to our price chart of seasonality, we see that late October is actually the most dramatically bullish window of all.
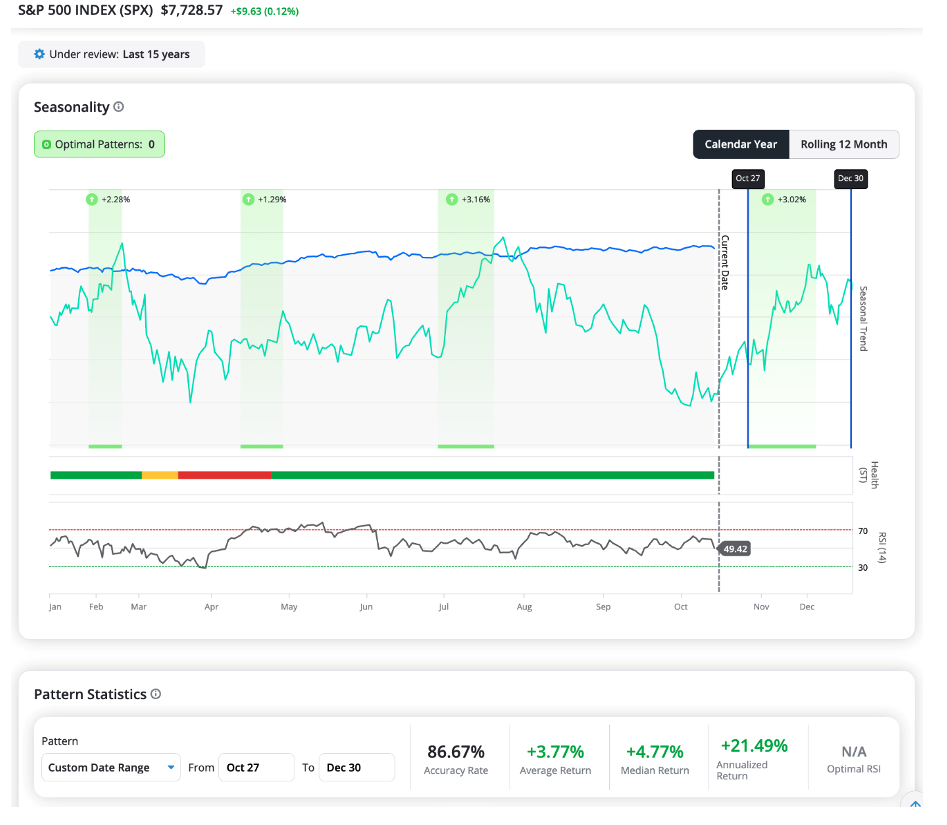
Below is that seasonal window, based on the past 15 years of historical prices.
Starting Oct. 27, the S&P 500 has gone up 3.8% on average through the end of the year, with some type of gain in 13 out of the past 15 years:
For subscribers to my seasonality trading services, October is waking up all our portfolios.
Trade opportunities are enormous and plentiful.
And this would be one of the absolute best times of year to check out our seasonality models like our Ninth Day portfolio, which my paid-up subscribers can access in early November.
William McCanless
Senior Analyst, Trade Cycles