How to Stay Safe in This Warp-Speed Market
Listen to the audio version of this article (generated by AI).
Imagine $15 billion in wealth going up in smoke every minute for 100 minutes straight.
It’s hard to wrap your head around.
But that’s what happened yesterday between 10:40 a.m. and 12:20 p.m. ET.
Following its sharpest one-day reversal since the “tariff tumble” in April, the S&P 500 wiped out about $1.5 trillion in shareholder value.
It was hard to pinpoint WHY this happened. There wasn’t any solid news to pinpoint the worst trading session drop in seven months.
There are fears right now about consumer debt, the economy, and private credit. Could it be that?
Or could it be that “Big Short” investor Michael Burry is right… and giant AI stocks like Meta Platforms (META) and Oracle (ORCL) are flattering their earnings by dragging out the depreciation of their computing equipment?
Or could it simply be that investors are skittish with valuations at record levels?
It’s impossible to say. Here’s what we do know…
On Oct. 28, the S&P 500 reached an all-time closing high of 6,890. At the time, investors were maximum bullish on AI. And they believed interest rate cuts were on the way that would juice the stock market further.
Since then, sentiment has swung in the other direction. The S&P 500 is down 5.4% from that peak. High-growth, high-volatility sectors such as semiconductors, space, robotics, and nuclear tech are down more than 10%.
Some high-profile growth stocks such as Coinbase (COIN), Robinhood (HOOD), and Rocket Lab (RKLB) are down more than 25%. Bitcoin has plummeted.
But it’s not the reasons for the fall that should concern you. It’s the speed at which it happened.
In a market like this, long-term indicators leave you exposed. You need early reads on sudden, short-term momentum shifts.
That’s why my team and I at TradeSmith created our new Short-Term Health indicator. It gives you a daily read on short-term trends, using a simple traffic-light system that shows whether momentum is bullish, neutral, or bearish.
As I’ll show you today, it’s a powerful way to spot short-term trends and opportunities in this warp speed market.
Before I show you how it works and how it can help you beat a buy-and-hold approach, here are three signs that this faster tempo is not a phase. It’s the new permanent setting.
Bigger, Faster, and More Online
In the late 1950s, the average holding period for U.S. stocks was about 8 years. By 2020, it had fallen to 5.5 months.
Before the pandemic, retail trading made up roughly 10% of all U.S. stock trading volume. That figure doubled to roughly 20% in 2020… and reached as high as 26% in the 2021 pandemic boom.
And in the first half of this year, retail investors pushed $6.6 trillion in volume through U.S. stocks—the largest such surge ever recorded.
These are not pension funds. Retail investors react to headlines. They often trade daily. They move in crowds. And most do it without any clear risk-management framework.
When tens of millions of these folks have zero-commission apps with access to fractional shares and same-day options trading in their pockets, the market doesn’t only get bigger. It gets faster.
Then there’s the effect of social media. It controls the news cycle right now, not traditional outlets like the Wall Street Journal, Barron’s, or Bloomberg.
Stories that used to play out in days to weeks now play out in minutes. And often, the popcorn effect of the social media herd amplifies falsehoods that spread panic in the markets.
Struggling movie theater chain AMC Entertainment (AMC) didn’t soar 3,000% in 2021 in because its business improved. It shot up because it became a meme stock that millions of new investors were buying into to try to “stick it to the man.”
Research now shows social-media chatter can predict intraday stock returns. And anyone following our MegaTrends advisory has seen with their own eyes how a single viral post can move a stock.
How to Keep Up With This Warp Speed Market
To help you cope with this new market tempo, we built the Short-Term Health indicator.
It measures a stock’s short-term strength against its recent behavior. This gives you a clear daily read on whether it’s showing healthy momentum, neutral action, or early cracks.
When weakness starts to build, you see it before it appears in our long-term indicators. When momentum starts to surge, it highlights potential entries after unusually sharp drops.
You can see how valuable these signals are by looking at how they handled one of the fastest-moving stocks in modern market history: Nvidia (NVDA).
This is the stock that defined the AI boom. It’s also a stock that punishes hesitation and rewards speed. Which makes it a perfect example of why indicators built for a slower era needed an upgrade.
If you’d had our Short-Term Health indicator on December 1, 2022, it’d have fired a buy signal on NVDA—right after the launch of groundbreaking AI chatbot ChatGPT.
Nvidia delivered a 155% gain over the next nine months. That’s when momentum stalled for a bit, and NVDA dipped into the Short-Term Yellow Zone:
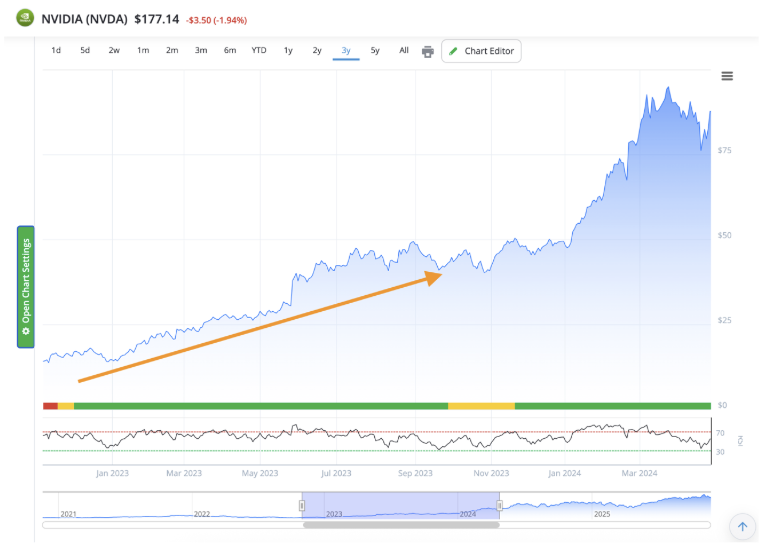
Then, in early 2025, the tariff shocks pushed Nvidia into a sudden 30% slide. But you wouldn’t have been caught in that downdraft if you’d been following our Short-Term Health indicator. A short-term sell signal triggered in February 2025, so you could have locked in gains before the stock broke down.
And after the panic faded and Nvidia bottomed, a new buy signal fired in May. That re-entry point could have added another 31% gain in just a few months as the stock snapped back.
These short-term signals don’t just help you make money. They help you keep it. They show you when to move out of a stock before the worst of the decline… and back in before the crowd regains its nerve.
I’m not saying buy-and-hold is dead. There’s a place in every portfolio for long-term positions you hold for years, even decades.
But our system shows you can sidestep a lot of unnecessary pain—and capture more upside—by staying mindful of the short-term trend.
When the market speeds up, your tools need to keep up with it. That’s why we built this new indicator… and the feedback has been fantastic.
If you have access, take a look at the stocks in your portfolio. Evaluate the long-term versus short-term health. Have a plan for when you’ll exit. And make a plan now before fear takes over in a correction or a crash.
That’s the key: You want to get out of your own way when fear grips the market.
It’s been another wild week in the markets. And as I’ve been hammering on in these over the past couple of weeks, it’s time to get a plan in place for everything to drastically change.
And the time to do that is now. As we saw this week, greed can switch to fear in the blink of an eye.
So make sure to catch up on the essential risk management steps here and here.
Stay safe out there, and have a great weekend.
All the best,

Keith Kaplan
CEO, TradeSmith
P.S. Have you put a solid risk management plan in place, as I’ve been urging you to do? Do you use some kind of stop-loss system? Do you regularly rebalance your portfolio? Are you finding value in these Friday insights? I’d love to hear from you. You can send your feedback, thoughts, and questions to [email protected].