Is Marc Chaikin’s Bearish 2026 Call Coming True?
Listen to the audio version of this article (generated by AI).
In This Digest:
- How a data-obsessed economist called the 1929 crash
- These Red Zone stocks could be the biggest losers in an AI bust
- Why we launched our new “flash portfolio”
If the last two months left you dizzy, you’re not imagining it…
From June into July, the tech-heavy Nasdaq 100 fell nearly 10%. Then, in just five trading days, it roared back by about 8%.
And those moves are mild compared to the whipsawing of popular AI trades this year.
For instance, memory storage company Sandisk (SNDK) soared as much as 748% through June 25, and then plunged 56% over the next month.
Spacefaring and proposed orbital datacenter company SpaceX (SPCX) surged 25% from its June IPO – creating $2 trillion in value – before collapsing 46% since.
And even AI poster child Nvidia (NVDA), up 21% at the peak this year while adding over $1 trillion in market cap, fell more than 19% from those highs.
That kind of back-and-forth has a lot of investors asking a simple question: Is the AI boom about to become an AI bust?
That brings us back to the bearish 2026 prediction from Wall Street legend Marc Chaikin that we shared with you in these pages last winter.
We’ll get into that shortly.
First, a name from history that should be on your radar right now.
Roger Babson was one of the few economists to call the 1929 crash…
Babson was an economist, statistician, and entrepreneur. On Sept. 5, 1929, he stood up at a business conference and warned that a “terrific” crash was coming.
Two days earlier, the market had hit an all-time high almost nobody thought it would give back.
Seven weeks later, it began to come apart… ultimately leading to the Great Depression.
That warning from more than a century ago is important to understand today, given TradeSmith’s Mega Melt-Up thesis.
If you’re just joining us, a Mega Melt-Up is a feverish bull market when prices rocket higher on the promise of a transformative new technology, rising consumer credit, and a surge in retail trading.
Babson pointed to the trend of regular investors borrowing money to buy stocks – one of the telltale signs of a Mega Melt-Up. He pleaded with indebted investors to pay off their stock market debts and not take on any more.
What did Babson see that millions of other investors missed?
From Babson’s data, while 40 of the 1,200 stocks on the New York Stock Exchange had risen an average of 42% since the start of 1929… half of the remaining stocks had dropped.
Even as the averages were setting records, most stocks were already sinking. The market topped out that same week. Then on Oct. 28 – “Black Monday” – it plunged nearly 13% in a single day.
In the three years that followed, the stock market fell 89% from its peak – the worst crash of all time. It would take 25 years before the market established new all-time highs.
Babson pioneered a type of analysis we take for granted today…
He counted the number of stocks making new highs versus the ones that weren’t and created a simple ratio.
If the ratio favored bullish moves, the coast was clear. If it favored bearish moves, it was a signal to get out.
It’s hard to overstate how rare this was at the time. In Babson’s day, the only respected way to analyze the stock market was to look at company fundamentals like earnings, revenue, cash, and debt.
Instead, he used what we now call “technical analysis.” And anyone who acted on his warning would have sidestepped the worst market crash in modern history.
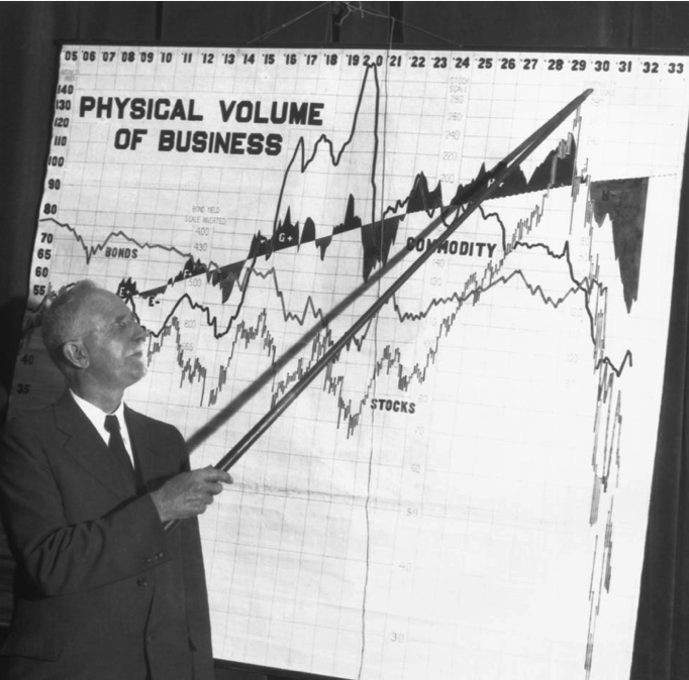
Here he is three years after the 1929 crash, showcasing one of the earliest pieces of technical analysis on record:
Some of the other principles Babson made popular also resonate…
- His work centered on mean reversion analysis – the idea that when markets move too far above their historical averages, they inevitably move back toward those averages.
- He warned against borrowing on margin to trade stocks – something that accompanies every Mega Melt-Up.
- He was skeptical of the idea that technological progress can override business cycles – an idea we always hear near the peaks of bubbles.
At TradeSmith, we have tools that help you do fundamental analysis on stocks. Our growth stock rating system, the Quantum Score, includes company financials along with money flows. Plus, our own fundamentals-driven Business Quality Score rates stocks predominantly on balance sheet figures.
But our technical analysis work has been a priority during this market melt-up.
We’ve taken a page out of Babson’s playbook…
Take his observation about the number of stocks trading with bullish momentum in 1929. We follow a similar metric – our Health Distribution.
Look at this chart of the Nasdaq-100 from our market monitoring dashboard, part of our Trade360 analytics suite.
Along with the price chart (blue), it shows the number of stocks in the index that are trading in bullish (green), neutral (yellow), or bearish (red). And it does this for both short-term and long-term trends.
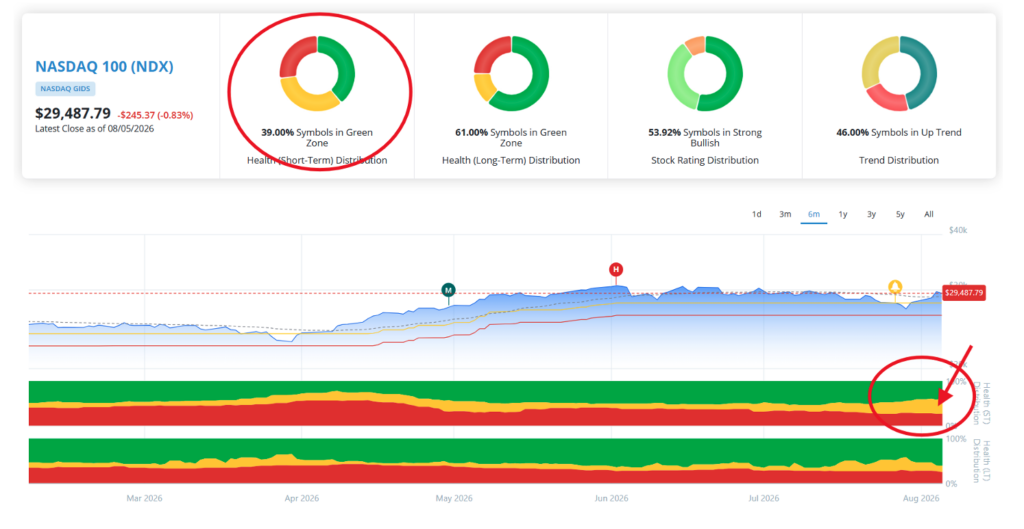
Pay close attention to the Short-Term Health distribution at the top left (circled in red).
Short-Term Health is TradeSmith’s most sensitive momentum indicator. It measures how a stock is trading against its own history of ups and downs, then sorts it into one of three zones. Green means a healthy uptrend. Yellow is a warning – the stock has pulled back partway toward its sell point. Red means the trend has broken, and it’s flashing a sell signal.
Right now, 39% of the Nasdaq-100 is a Green Zone. About 27% is in a Red Zone. And 34% is in a Yellow Zone.
So while most stocks are in Green Zones, it’s not a runaway lead. At the start of 2024, for instance, more than 80% of the index was in a Green Zone. And as you may fondly remember, 2024 was largely a one-way bull market with only a few shallow dips.
That’s not what we have today. And as you’ll see from the bottom right of the chart (also circled in red), the number of stocks in a Yellow Zone is growing fast, while the number of stocks in a Green Zone is shrinking.
Similar to Babson’s warning ahead of the Great Depression, the number of stocks in the tech index trading bullishly is falling… and the number of stocks trading bearishly is rising.
And that’s just one reason we’ve been sounding a note of caution here at the Daily.
There’s also Marc Chaikin’s bearish call for 2026…
Marc has more experience on Wall Street than anyone I know.
He started as a broker in 1966, back when trades still came through on ticker tape and before electronic quote systems, phone-based retail trading, or anything resembling online brokerages.
Over time, he’s worked as a stockbroker, analyst, and head of the options department for a major brokerage firm. He’s been through 10 bear markets and survived them all.
These days, Marc heads up Chaikin Analytics, a fintech platform and publisher that helps regular investors navigate the market using Wall Street-level analytics.
If that all sounds familiar, it’s because we’re cut from the same cloth.
Chaikin Analytics and TradeSmith share the mission to break Wall Street’s grip on elite investment technology and put it in the hands of regular investors.
That’s why when Marc started calling 2026 the Year of the Bear last summer, our ears perked up.
TradeSmith is built on a foundation of risk management. TradeStops, our first software innovation, helps over 134,000 users around the world protect their downside risk (and maximize their gains) on over $29 billion in portfolio assets.
Marc’s outlook isn’t rooted in sky-high valuations… technical patterns… or comparisons to earlier tech manias. He’s basing it on a four-year political cycle that’s been remarkably consistent over more than a century of data.
Here’s the basic idea…
In the lead-up to an election, Washington usually steps on the gas – stimulus, spending, and anything that keeps voters upbeat. Markets often surge on the back of that support.
But once an administration has secured the vote, the incentives flip. The policy sugar high fades, and the market begins to show its cracks.
The real trouble starts to hit in midterm election years…
Look back across the last 14 election cycles, and a pattern jumps out.
Bear markets either started or were already underway in 9 of those 14 midterm years – roughly 65% of the time.
- Four years ago, we got the 2022 bear market. The S&P 500 fell 20%.
- In 2018, stocks ended the year down 6.2% after falling as much as 11%.
- And in 2002, at the tail end of the dot-com bust, the index fell as much as 34%.
And our Short-Term Health indicator shows that leading tech stocks saw warning signs weeks ago.
- Tesla (TSLA) triggered a sell signal on July 7. Since then, the stock is down 21%.
- Uber (UBER) triggered a signal on Nov. 25, 2025. Since then, it’s fallen 18%.
- And cryptocurrency exchange Coinbase (COIN) is down 48% since its sell signal on Nov. 14.
There are plenty of AI stocks out there that haven’t flashed “sell” yet. But more of them have entered Yellow Zones – including Nvidia (NVDA), Amazon (AMZN), and Google parent Alphabet (GOOGL).
How do you trade in a market like this?
Selectively… and nimbly.
Marc and TradeSmith CEO Keith Kaplan agree: Today’s is faster and more volatile than it’s ever been.
Crashes are unfolding in weeks, days, and even hours… not months or years like they did before.
That’s why Keith and Marc launched a new “flash portfolio” designed exactly for the kind of high-volatility market in the cards in 2026.
It combines the fundamental and money flow analysis from Marc’s Power Gauge indicator with our new short-term buy and sell signals to stay in strong stocks in bullish trends.
Only the top five stocks that tick both boxes get added to the model portfolio. You then move into a new set of five top-ranked stocks at the start of each month.
In a backtest from October 2019 to March 2026, it turned a stake of $10,000 into nearly $70,000. That’s a 600% return against the S&P 500’s 138% gain over the same stretch.
That works out to about 35% a year – more than double the S&P 500’s roughly 14% a year. And it did that holding just five stocks at a time, with a worst-case drop (34%) no deeper than the index’s own.
It’s everything we’ve been doing at TradeSmith this past year in one strategy. Our machine learning model, powered by AI, selects the stocks. But not before our Flash signals and Marc Chaikin’s Power Gauge flag them as strong contenders.
To get the full story, including Marc Chaikin’s full bear market thesis for 2026, click here.
To building wealth beyond measure,
Michael Salvatore
Editor, TradeSmith Daily