Pay Attention to the Number Nine
Listen to the audio version of this article (generated by AI).
In This Digest:
- Why the ninth trading day of the month is an anomaly worth understanding
- This non-AI chip stock enters a bullish seasonal window tomorrow
- Our master trader is eyeing a bitcoin breakout after a quick 75% win, and Predictive Alpha is bullish, too
Want an edge in the market? Then keep an eye on the number nine…
At TradeSmith, we employ dozens of data scientists, researchers, and investment analysts to uncover the hidden patterns in the market.
Sometimes those patterns are so complex only a machine learning algorithm can find them. Other times, they’re as simple as a date on a calendar.
Take the ninth trading day of the month. According to our head of research, Mike Carr, it’s a day worth watching closely.
To see why, it helps to know how Mike hunts for patterns like this in the first place.
He’s the man behind our Seasonality tool. It digs through decades of price history to find the stretches of the calendar when a stock has tended to rise – or fall – again and again, almost like clockwork.
Mike is always fine-tuning it to pin down the best times of year to buy and sell.
And recently, he made a discovery about that ninth trading day.
Here, Mike explained it in a research presentation all about this anomaly…
My team and I ran thousands of tests on the best day to buy. We tried weekly. Every two weeks. Monthly. Every 45 days. Mondays versus Fridays. The start of the month versus the end. Then one night, around 2 a.m., one number kept showing up in every test. The number nine.
The ninth trading day, it turns out, is the single-best day of the month to buy into one of top strategies.
Why is the ninth trading day of the month optimal as an entry day? Mike again:
Most institutional investors – pension funds, hedge funds, mutual funds – make their major allocation decisions at the beginning of each month. They rebalance their portfolio, deploy new capital, and adjust positions.
This creates enormous noise during the first trading week of the month.
But by the ninth trading day, the fog clears. Institutional money has been deployed. Earnings dust settled. And the true momentum leaders separate themselves from all the noise.
That discovery led Mike to build a new strategy. In testing, it grew by an average of 54% a year over six and a half years – turning into a total gain of 1,553%. And 77% of its trades came out winners.
Backtested results aren’t the same as live returns. But when a strategy puts up numbers like that in testing, it’s worth paying attention to.
If you want to learn more about this anomaly, including all the details behind the strategy that takes advantage of the top seasonal trades on the ninth trading day of every month, go here for the full story from Mike Carr himself.
In the meantime, take a look at this seasonal window opening tomorrow…
As we’ve been covering here in the Daily, the semiconductor sector has been beaten up lately.
Even as the S&P 500 has climbed to new highs over the last two weeks, the iShares Semiconductor ETF (SOXX) is still more than 19% below its June highs.
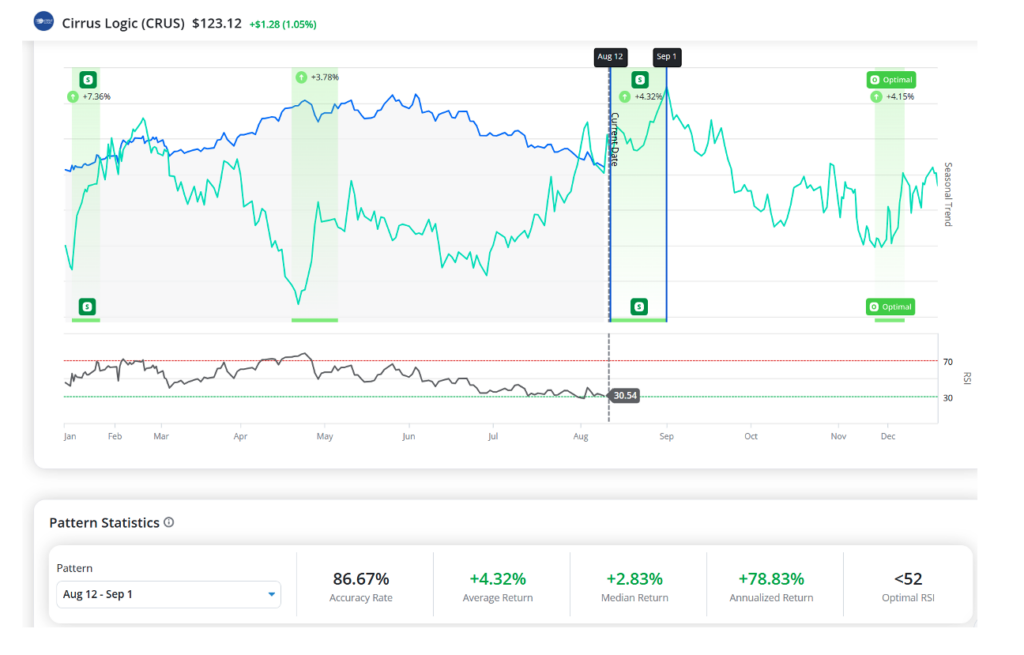
But at least for one smaller chip stock running into a strong seasonal pattern, that run of poor performance could be shifting. Take a look at this seasonality report of Cirrus Logic (CRUS):
Cirrus doesn’t make chips for AI applications, like Nvidia, AMD, or Intel. They make chips that power the audio processor on your phone that lets you make phone calls, the speaker in your car, and the microphone on your smartwatch.
That hasn’t stopped it from getting swept up in the semiconductor frenzy this year. At its heights, CRUS was up 49% on the year. Since then, it’s given all of those gains back and is now flat.
But it’s running into a key seasonal window beginning tomorrow, Aug. 12, and running through Sept. 1.
From that span of time, CRUS has dropped in all but two of the past 15 years for an average return of 4.3%.
It’s also trading below its Optimal Relative Strength Index (RSI) level. RSI measures overbought and oversold conditions, and Optimal RSI determines what technical state a stock has most often been in during the best seasonal returns.
CRUS is cheap, too. Its price-to-earnings ratio sits at 14.9. Meanwhile, the average stock in the iShares Semiconductor ETF (SOXX) holds a P/E of 40.
Keep an eye on CRUS here – either as a short-term trade for its seasonal window through September, or as an entry point into a cheap chip stock that’s not directly exposed to the white-hot AI trend.
Is bitcoin about to break out? This signal suggests it could…
Bitcoin has been a disappointment in 2026. After rising more than 600% from its bear market bottom in November 2022 to its 2025 highs, the original cryptocurrency is now down 47% from those highs and 26% this year alone.
AI has sucked the air out of the room, and bitcoin is barely a topic of conversation this year.
But that doesn’t mean the price doesn’t move. And all any good trader needs is evidence that a big move is coming.
Our master options trader Jeff Clark has been watching the chart of bitcoin closely in both his Market Minute e–letter and in his Delta Report advisory.
On July 24, Jeff recommended his Delta Report readers close a bullish position on the iShares Bitcoin Trust ETF (IBIT) for a 75% gain in just three weeks.
He also recommended a new trade on the same ticker for his subscribers on Monday.
And in today’s Market Minute e-letter, Jeff laid out his case for why he thinks bitcoin is headed higher.
The chart has morphed into an ascending triangle pattern – which is when the assets make a series of higher lows, and keeps banging into resistance at the same level. This is a bullish pattern that usually resolves with a breakout above resistance and an immediate move higher.
If bitcoin can rally above the July high of $66,500, then it’s likely headed towards our $75,000 target.
But it’s not just how the chart looks. More from Jeff…
Most important, though, and what doesn’t show up in the chart, is the lack of any interest in bitcoin at the moment. Nobody is trading it. The volume in all the various bitcoin ETFs is at the lowest level in a year.
The traditional bitcoin cheerleaders aren’t showing up on any of the financial television stations. And these days the phrase, “To the moon!” is more likely to be shouted by gas station owners than the bitcoin faithful.
Per Jeff, the fact that nobody’s talking about bitcoin makes it more likely to surprise to the upside.
And our AI-powered forecasting tool, Predictive Alpha, agrees.
Regular readers know Predictive Alpha is TradeSmith’s AI-powered price forecasting engine – best thought of as a large numbers model.
In the same way large language models predict the next word in a sequence, Predictive Alpha predicts the next price move.
Trained on more than 100 billion data points, it projects where a stock is likely to land up to 21 trading days out.
Here’s the current price forecast for the iShares Bitcoin Trust ETF (IBIT):
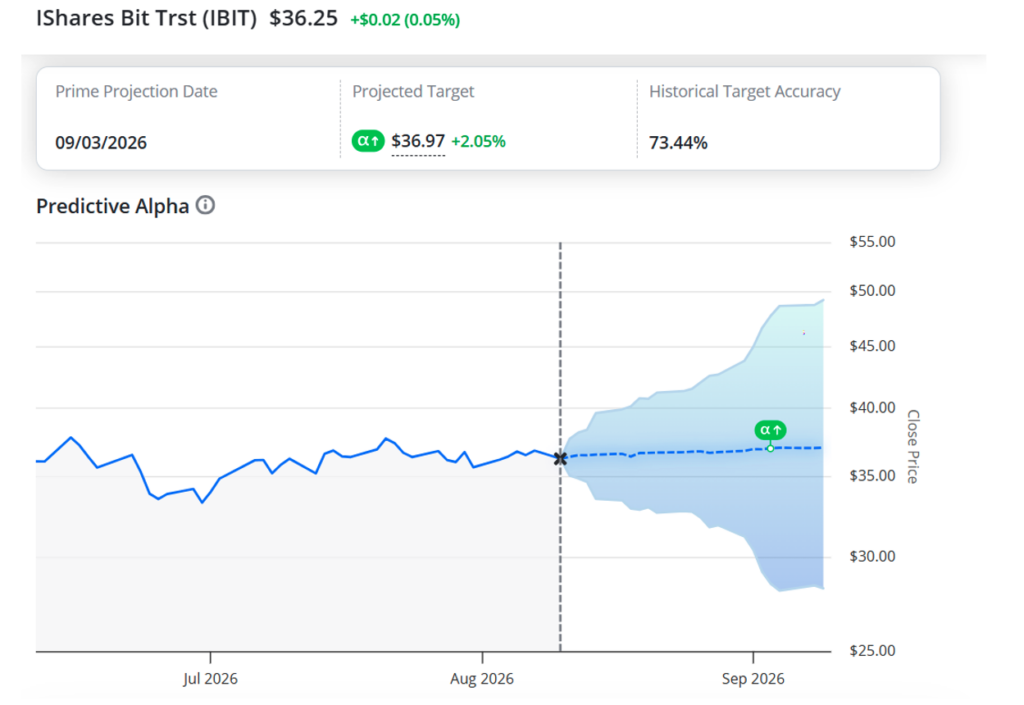
Predictive Alpha sees a 2% gain in Bitcoin between now and Sept. 3, and more than 73% of forecasts have been accurate in the past.
That’s a small move, but a key one for bitcoin to make right now.
If IBIT rises 2%, that puts it at its highest closing price in close to a month. And it would help set another higher low on the chart – suggesting a short-term bottom in bitcoin prices.
Not to mention it would mean a nice gain for Delta Report subscribers and the IBIT trade Jeff currently has on.
Keep an eye on bitcoin over the coming weeks. Evidence is mounting that we’re near at least a short-term bottom in prices.
And I highly suggest signing up for Jeff Clark’s free newsletter, Market Minute. There he shares plenty of short-term trade ideas just like this one.
To building wealth beyond measure,

Michael Salvatore
Editor, TradeSmith Daily