The Infinite Income Manifesto
Welcome!
In this report, we’ll show you several ways you can leverage these options trades to give yourself the best chance of success – and we’ll point out the pitfalls you should be aware of.
Most traders have a love-hate relationship with options. It’s easy to be seduced by the leverage and potential returns they offer.
However, most options contracts that traders buy end up expiring worthless. You see, trading options is not as straightforward as trading stocks.
The value of an option is derived from three main factors:
- The time between now and the contract’s expiration date…
- Implied volatility (IV), or the demand for options…
- And the distance between the strike price and the underlying asset.
Interest rates and dividends impact options to a lesser degree, so most traders won’t need to consider these factors.
Having an opinion on price direction alone doesn’t cut it if you want to buy options, whether you’re looking at calls (bullish trades) or puts (bearish trades).
For example, have you ever bought a call option for a stock you’ve liked and watched the stock price rise, only to see the value of the options contract decline?
You just learned a hard lesson about implied volatility.
Or, have you ever bought a call option, and the stock didn’t start to rise until you had only a few days left until expiration?
You just learned a hard lesson about time decay.
By the expiration date, these contracts will either close in the money or expire worthless.
You have two factors working against you whenever you buy an option: time and volatility.
These two factors make buying options highly speculative, and that’s why buying options has a bad rap.
However, buying options isn’t the only way to go. In a few moments, you’ll learn about one of the most effective and profitable options strategies out there.
Instead of trading like the retail audience, you can become the market maker — those powerhouses that rake in cash like a casino.
And once mastered, you can use this strategy to “generate income” on a monthly or even weekly basis.
The beauty behind the strategy is it allows you to set the price at which you’re willing to own a stock or exchange-traded fund (ETF). And if it doesn’t reach your price, you still can generate income.
IMPORTANT NOTE: Trading is risky, and you should NEVER put more money into a trade than you can afford to lose. And of course, none of what you’re about to learn should be taken as financial advice. Please do your own research.
Taking Advantage of the Options Market
Let’s start with some options basics.
Options have two types of value: intrinsic and extrinsic.
Intrinsic value is the value of an option’s price left over at expiration or the amount of “moniness.” For example, if you own a call option with a strike price of $80 and the stock currently trades at $82, then you have an intrinsic value of $2 even if that option trades for $3.
The remaining value after you take away the $2 is known as extrinsic value, which in this example is $1.
Extrinsic value is also called time value. All options have a time value, which declines (for buy contracts) and increases (for sell contracts) as the contract approaches the expiration date.
- Stock Price – Strike Price = Intrinsic Value for Calls
- Strike Price – Stock Price = Intrinsic Value for Puts
Out-the-money and at-the-money options only consist of time value. Here’s how we calculate the extrinsic value:
Options Premium – Intrinsic Value = Extrinsic Value
For example, let’s say ticker symbol XYZ is trading at $50 per share. The $50 calls expiring in 14 days have a premium (cost) of $2.
At expiration, these options will expire worthless if the stock’s price is trading below the strike price. In other words, the $50 XYZ calls in this example consist of $0 in intrinsic value and $2 in extrinsic value.
Let’s say XYZ is trading at $51 and the $50 calls expiring in 14 days have a premium of $3. In this case, the intrinsic value of these options is $1, and the extrinsic value is $2.
Only in-the-money options have intrinsic value.
Leveraging Implied Volatility
Remember how we talked about the three main components that make up the price of an option?
These factors are known and can be plugged into an options pricing model — except volatility.
Options volatility (often referred to as implied volatility) is derived from the supply and demand in the options market.
Implied volatility changes with the market and is never fixed.
During periods of fear and uncertainty, the prices of options will shoot up because the demand for put premium and portfolio protection increases.
On the other hand, implied volatility will decrease when a stock is in an uptrend because traders aren’t as worried about big swings to the upside or downside.
Keep these rules in mind:
When implied volatility rises, options become more expensive. When implied volatility declines, options become cheaper.
Here’s another thing you should know about volatility: Volatility is mean reverting.
Periods of high volatility are often followed by periods of low volatility (and vice versa).
We see this in the CBOE Volatility Index (VIX), which measures volatility in the S&P 500 index.
In the chart below, each candlestick represents the open, high, low, and closing prices of a single trading day.
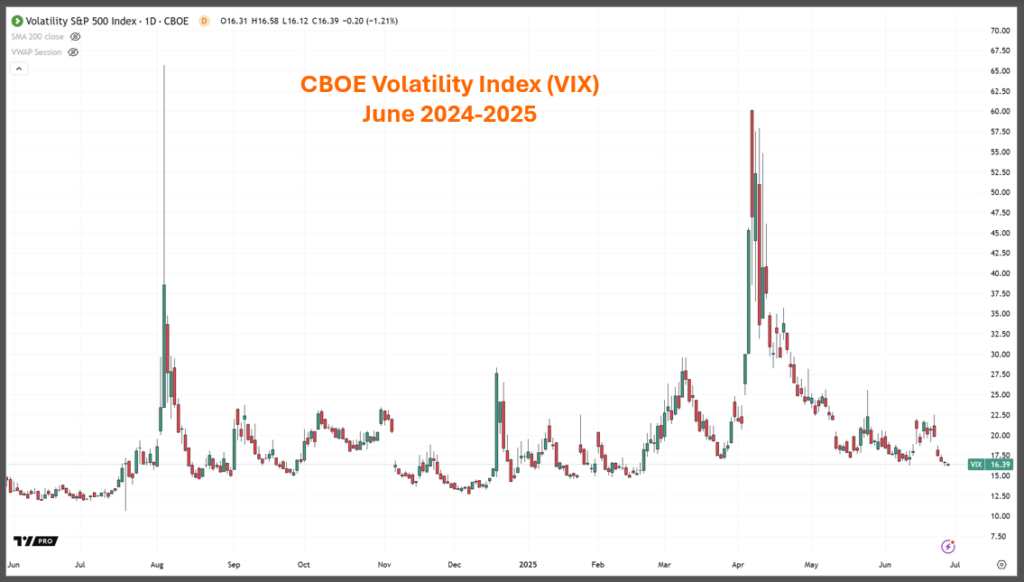
Notice how after the VIX spikes, it rarely spends much time in that overbought area, eventually falling back to around $16.
For reference, the historical average in the VIX is between $15 and $18.
We see mean reversion frequently around corporate earnings announcements.
Implied volatility rises as earnings announcements approach and declines immediately thereafter.
Regardless of whether the earnings news is good or bad, traders expect a greater-than- normal move. And because of that, options are typically priced at their highest right before the earnings announcement.
But after the earnings release is made, uncertainty washes away and implied volatility in the options drops significantly.
Our core strategy looks to take advantage of the options market by selling contracts in high-quality stocks when options volatility is above normal, not necessarily driven by earnings.
Get Paid to Buy Stocks You Want
January 2022 saw one of the worst market sell-offs in years. Fears of the Federal Reserve tightening policy and increasing interest rates pushed tech stocks down double digits, some down 50% to 70% from their all-time highs.
For example, on Jan. 28, Disney stock closed at $138.63 per share, more than 31% off its 52-week highs.
A trader could buy stock and hope they picked the bottom. But timing the market isn’t easy.
However, as we mentioned earlier, implied volatility often rises as a stock drops. So, if we’re selling options, we have an advantage here. We can structure a trade that theoretically puts the odds in our favor using options.
Example No. 1: Disney March 4, 2022 $120 Puts

Let’s say we are interested in buying Disney shares at $120 if the stock gets to that level. We could wait for the stock to potentially fall to that level. Or we could sell the March 4
$120 puts for about $1.30 per contract, receiving a $130 credit in premium (because each contract controls 100 shares of stock).
The March 4 $120 puts have about $1.30 per contract in extrinsic value. In other words, these options will expire worthless unless Disney shares see a 14% decline.
So, we would either collect the premium or get a chance to buy the stock at a lower, more desirable price.
We’ll get to keep that premium for selling the contract regardless of whether the stock finishes above or below the strike price.
Now, let’s say that Disney trades down to $115 by March 4. We could be assigned (obligated to buy) 100 shares of Disney stock per contract at $120, for a total cost of $12,000. However, we would keep the $1.30 per share premium.
The effective purchase price would be $120 – $1.30 = $118.70 (a total of $11,870).
When we sell put options and collect premiums, this is the start of how we can generate income using options.
There are two scenarios here, and either one can work in our favor. First, a stock finishes above the option’s strike price at expiration, expiring worthless and allowing us to keep the premium.
Second, the stock finishes below the option’s strike; we collect the premium and use it to reduce the cost of stocks we want to own.
Example No. 2: Tesla March 4, 2022 $600 Puts
Tesla shares were down by more than 20% at one point in January. After climbing to
$1,200 per share, they declined as low as $792 per share in just a few short weeks. On Jan. 28, shares closed at $836.14.
Let’s assume you felt the sell-off was overdone, and at least in the near term, you think Tesla will rally or stay range-bound.
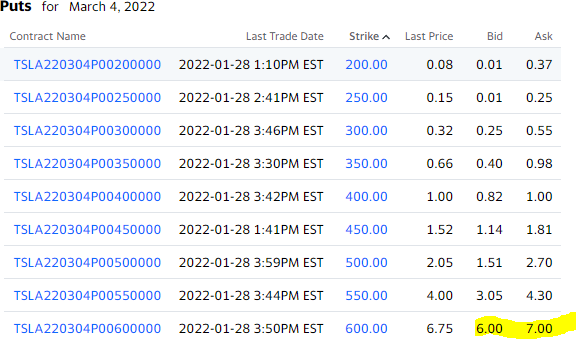
The March 4 $600 puts are trading for about $6.50 (the natural price between bid/ask).
If we were selling one of these contracts, we would collect $650 in premium. We will get to keep all our premium at expiration if Tesla stays a penny above $600 per share.
In other words, we’d have a 28% cushion from where the stock is trading now.
This is what we mean when we say theoretically the odds are in our favor. And while there is a chance the stock can decline further to go below the strike price, we are getting paid to take on that risk.
This strategy is a game-changer when you focus on stocks you want to own. You’re either going to get them at a cheaper price or you’ll generate a yield.
Generating Monthly Income from the Strategy
To take advantage of this strategy, you’ll need clearance from your broker to sell options, along with a margin account or approval for the sale of cash-secured puts.
There are two types of margin accounts: Reg-T and Portfolio Margin. Here is how TD Ameritrade explains the difference:
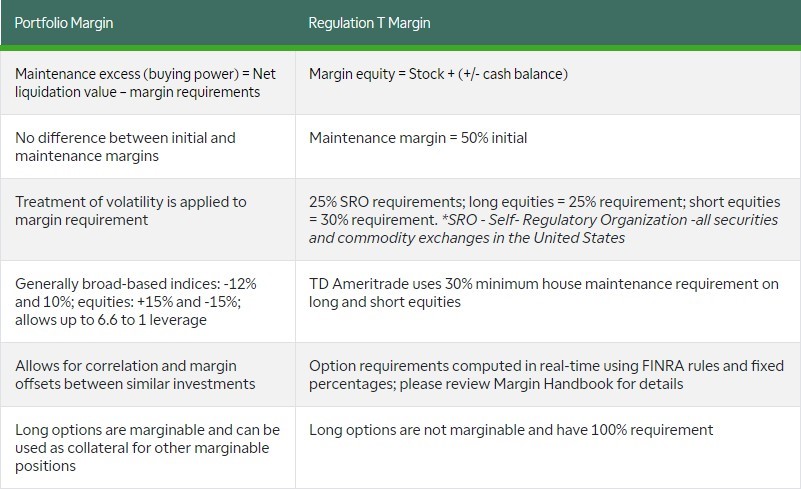
Whenever you sell an option, funds move into your account.
However, it’s not free money. Your broker will ask you to keep a specific amount of cash available in your account to manage the position’s risk.
A Reg-T Margin Account requires more capital to maintain the position. While a Portfolio Margin Account has friendlier terms in respect to margin maintenance, it typically requires an account size of $100,000 or more.
To keep things safe, we recommend selling cash-secured puts.
In other words, you have the cash in your account to buy 100 shares of the stock in case its price dips below your strike price. This cash cannot be used for anything else. Since it’s tied up, we look at the premium we receive as our return on investment.
Earlier we looked at some Tesla options expiring 33 days from the contract open date, with the stock trading at $846.35.
March 4, 2022, $600 puts were going for about $6.50 per contract.
Let’s say we only had $75,000 in our trading account and decide to sell one contract. We have enough funds to purchase 100 shares if the stock dips below $600.
On a Reg-T Margin Account, our broker will ask to have about $9,500 on hand to cover the risk. However, the amount of cash required by the broker will go down as the stock price increases and time withers away. On the other hand, the amount of capital required would increase if the stock price continues to decline and approaches the strike price.
Either way, with a $75,000 account, we have enough capital to take on 100 shares if we are assigned the 100 shares covered by this contract.
A quick look at the math: If we’re able to make $650 from this trade by only putting out $9,500 for margin, we’re looking at a potential 6.8% gain in about a month’s time frame. Annualized, that comes out to a 71.4% return on investment.
Remember, the math above is for when you sell a put with margin or borrowed funds. A cash-secured put would require $600 x 100 shares, or $60,000 be set aside for the trade. That generates a return of 1.1% over a bit more than a month or 11.3% annualized.
If you can find opportunities like that consistently each month, your account will see great results over time.
How Traders Mess It Up
While selling puts for income is an exceptional strategy, there are ways you can mess it up.
The most common is confusing cash-secured puts with selling puts on margin.
Going back to our Tesla example, we had $75,000 in our hypothetical account and sold one $600 put contract for $650.
However, we assumed the broker only asked for $9,500 to maintain the position. This is called selling puts on margin.
There is nothing that is stopping us from selling two contracts. If we did that, we’d collect $1,300 in premium.
The broker would now require $19,000 in premium to maintain the position. At $600 per share, we would need $120,000 to cover 200 shares.
Since we’ve already said the account value is $75,000 (less than the full amount required), there is a chance our losses could exceed the account value after this one trade.
In fact, the broker calculates what the Point of No Return (PNR) would be.
PNR is the percentage move in an underlying stock’s price at which an account will lose 100% of its equity.
In this case, Tesla would need to drop by 74% for us to get completely wiped out on a single contract.
It’s unlikely, but the risk is there.
And that’s how so many traders mess this strategy up.
Instead of taking on what they can handle, they abuse the leverage, oversize their position, and eventually wind up in debt.
However, if you stick to what you can afford (by selling only cash-secured puts), then you can avoid blow-up risk since you have all the cash necessary to buy the stock already in your account.
Best Practices: Putting It All Together
When To Apply the Strategy
You want to apply a cash-secured puts income strategy when you’re bullish on a stock. It allows you the chance to pick up shares at a cheaper price or collect a premium.
Since we’re trying to collect premium, we want to sell stock options when their implied volatility is relatively high.
Implied volatility shoots up when there is fear and uncertainty. And it declines when stocks are strong, and investors become complacent.
But how do you know when that is?
Most brokerage platforms rank implied volatility over time.
For example, the 30-day implied volatility for Tesla options on Jan. 28, 2022, was 65.4% Is that high or low?
There are two ways to measure implied volatility: percentile and rank.
Percentile looks at the current implied volatility and tells you the percentage of days where implied volatility was lower than the current implied volatility. You can think of this in terms of ACT/SAT scores, where the number itself doesn’t matter as much as how it compares against others. With a percentile score, we’re comparing the current implied volatility’s place within the range of all other IVs over the course of a year.
We prefer to use the implied volatility rank (IVR), which takes the range for the last 52 weeks and tells you where the current implied volatility lands in that range. Think of IVR as grading the implied volatility on a curve.
We believe the IVR is the better measure because it is less susceptible to sustained periods of low or high volatility.
As an example, if you look at the 30-day implied volatility in TSLA over the last 52 weeks, you’ll see that the IV lows were 35.7% on Oct. 15, 2021, and the IV highs were 86.9% on March 8, 2021. We can then analyze the current implied volatility of 65.4%, as within the 73rd percentile with a rank of 58%.
In other words, an IV of 65.4% is high for this stock.
You want to make sure you are comparing IV rank against the same stock. For example, a 30-day IV of 35.7% on TSLA is low, but a 35.7% IV in AAPL is sky-high.
A relatively high IV rank means that when implied volatility reverts to the mean, the price of the option contract drops, all things being equal, which benefits us when we’re selling options.
So, you’ll get the most bang for your buck when you focus on selling puts when the IVR is above 50.
Strike Price Selection
As a simple rule of thumb, the further out-of-the-money you go, the less likely a stock is to close in the money. Consequently, the premium you receive also declines.

For example, let’s say we wanted to sell the March 4, 2022 $450 puts. That’s 46% lower than where TSLA closed at $846.35 on Jan. 28, 2022.
Since this is a very out-of-the-money put option, the margin required is significantly less than it is compared to selling the $600 put.
Let’s say we were able to sell the $450 put and collect $1.30 per contract. The Reg-T margin is somewhere around $4,600.
In the best-case scenario, this trade has an opportunity to yield about 2.8% in about 30 days or so.
It’s not as high as if we sold the $600 put. But it makes sense, right?
Selling the $450 put is safer than selling the $600 put, and that’s why the payout is smaller.
Expiration Selection
Now, the further out you go, the more time premium you can capture. However, that doesn’t necessarily make choosing longer-dated options a better choice.
It depends on your view of the stock and its price action.
The extrinsic value will erode the fastest when dealing with weekly options.
Some traders will compensate lower premium collected by selling more contracts. Of course, this strategy is dangerous.
Bottom line: It’s easy to overleverage weekly options because the maintenance margin is relatively small. However, it can balloon fast if a trade turns south on you. The best way to avoid this is to have the full amount in your account for a cash-secured trade.
Things to Consider
One thing we haven’t touched on yet is options liquidity. Ideally, we want to be trading options that have a lot of activity.
We can do this by looking at the options open interest and volume.
Generally, we want to focus on contracts with an open interest of 1,000 or more. Open interest refers to all the outstanding contracts which are still open.
We also want to look at the volume for an option contract typically around midday (it can take time for contracts to accumulate daily volume). Ideally, we want to see 50 to 100 contracts trade for that day, at a minimum.
In addition, we want to focus on options contracts where the difference between the bid price and ask price, known as the bid/ask spread, is competitive.
For example, the bid/ask spread on AAPL options is usually less than $0.10. The smaller the spread, the less slippage you’ll have when executing your trades.
It’s true, the type of trades we are pursuing have a high probability of succeeding. However, not all of them are going to work. Let’s say something comes up, and you don’t want to own stock if your short puts go in-the-money.
You are never locked into a trade (until it expires or gets exercised). That’s why liquidity is important. If you wanted to close your position for a loss, you would simply buy back the put contracts you sold. If the trade turns south on you, and you have to buy back your puts, you could get chopped up from the bid/ask spread.
Some strike prices will have greater open interest than others. If you can, stick to the most liquid ones based on the options volume and open interest, and offer a competitive bid/ask spread.
How To Work the Strategy
You can sell out-the-money put options on stocks you wish to own. Let them expire worthless or in-the-money and take a stock position.
But there are even more creative ways to play the strategy. For example, let’s say your main goal was income.
One way you can play the strategy is by setting up a trade that is about 14 to 30 days until expiration.
Let’s say we sold the March 4, 2022, TSLA puts at $600 for $6.50 in premium. Imagine, the next day, Tesla shares shot up by $100 per share, and the $600 puts went from $6.50 to $4. You could hold onto the position and let the time decay work in your favor.
However, you could buy back the contract for a profit and establish a new position, either the same strike price at a further-out date or a higher strike price using the same contract period.
Nothing says you must hold the contract until expiration. If the stock moves in your favor, feel free to close out the trade early and release that cash.
This can be a rinse and repeat process.
You can play options on the same stock each month, or you could focus on a basket of companies you like that are experiencing above-average options volatility.
What if you just have an opinion on the stock only and not the options?
Let’s say you love a stock. However, it’s had a nice runup of late, and buying shares here would feel like you are chasing it up.
In this case, the implied volatility in the options is likely cheap. Does that mean you should abandon the strategy?
No. You still could implement it and have a chance to participate in the stock’s upside. Selling cash-secured puts is the anti-chasing strategy.
In Summary
Financial professionals will tell you that picking tops and bottoms is impossible in the stock market. And while it’s most likely true, it doesn’t mean you always have to be in stocks.
Selling cash-secured puts allows traders to collect premiums and generate yields on stocks or ETFs they wish to own for a lower price than they are currently trading.
Getting the timing and volatility right is not as important when implementing this strategy because you’re giving yourself a theoretical advantage with some wiggle room.
You’re not locked into any position. You can always buy back your put options before the expiration date for whatever reason (cutting losses or taking profits).
We believe this strategy is significantly safer than buying calls or owning the stock outright. However, the upside on the system is limited. Your best-case scenario is the premium you collect per contract.
If the stock were to absolutely skyrocket higher, you would not fare as well as someone who owned shares of the stock.
And, while selling out-the-money puts gives you some wiggle room, it does not entirely hedge you against a market crash.
Just like any other strategy, this one has its risks and rewards. But if you’re a stock market bull, selling cash-secured puts is a viable strategy that eliminates many of the complexities of options trading — and gives traders a chance to get involved in stocks or ETFs they’d like to own at a price cheaper than they’re currently trading.
Want to learn more about this strategy and how you can leverage it in the extremely volatile markets we’ve seen this year? Just click here to view this brief instructional video. Millionaire trader Jeff Clark will show you why he’s calling this his #1 income strategy for 2025 – a strategy that is 18 for 18 so far this year, with a 100% win rate.