The Market Doomsayers Will Hate What I’m About to Say
Listen to the audio version of this article (generated by AI).
Last December, while everyone was toasting to a fresh year of gains, I warned my subscribers that 2026 was going to be choppy and difficult for traders.
I couldn’t have told you a single headline that was coming. I actually do my best to ignore them when I trade. Because I don’t need headlines…
I just need the calendar.
And what happened? Yep – 2026 turned into a white-knuckle ride.
In February, software stocks cracked. The Nasdaq 100 dropped -7.1% from the end of January into the end of March… meaning trillions of dollars in market value went up in smoke.
Then in June, it was the AI chipmakers that really turned sour. Micron Technology (MU) had been screaming 222% higher in April/May – so, everybody thought we were back on the bull train. Until MU lost -16% in a week… Nvidia (NVDA) fell almost -10% in June… and Sandisk (SNDK), another memory-chip stock, dropped -13.6% in a single session.
Overall, the iShares Semiconductor ETF (SOXX) – which tracks the biggest chipmakers on the planet – is down -23.8% since topping out in June.
So – just when it looked like the markets were going to go on a tear and the worst was behind us – bam! It all dropped again.
Is this the new normal? Is your strategy broken? After all, lately even the best performers didn’t actually gain very much… while the rest dropped -10%, -15% in what seems like the blink of an eye.
Well, I’ve got good news for you…
In about 30 days, all of that could change:
One of the most reliable signals I track points to the start of a nine-month, face-melting rally. One powerful enough to make doomsayers like Michael Burry and Jeremy Grantham cry into their morning coffee.
How can I be so confident?
Because going back over the last 20 midterm election years, like the one we’re in now – this bullish pattern has played out 89.5% of the time.
Today, I’ll show you what that means for your portfolio – and a specific sector that’ll prepare you for this rally. First, let me tell you how I knew this year would be rough before it even began. That way, you’ll be prepared next time markets reverse “out of nowhere.”
This Year’s Volatility Was No Surprise
I’ve apprenticed with proprietary trading firms, futures traders, and former CBOE options market makers. Over that time, I’ve tried pretty much every trading strategy out there.
These days, I track high-probability cycles backed up by decades of historical market data with Trade Cycles. It uses TradeSmith’s seasonality software tool to identify the most reliable trading windows for thousands of stocks.
Our proprietary algorithms scan decades of historical data – and pinpoint specific windows when stocks tended to rise and fall 80%, 90%, even 100% of the time.
So I knew there was a strong likelihood this year was going to be choppy… Before it had even started… because TradeSmith had already identified these bullish and bearish windows for me.
And I began warning my subscribers to tread carefully in December 2025.
What I specifically told them was:
“Midterm elections are one of the most reliable and bombastic seasonal windows of every four-year presidential election cycle. It’s a tricky market at the beginning, alright? If you don’t have access to the data, the choppiness of the market at the beginning of the year can slap you in the face.”
You can see what I mean in the chart below. It shows monthly returns for the S&P 500 over the last 20 midterm election years since 1950.
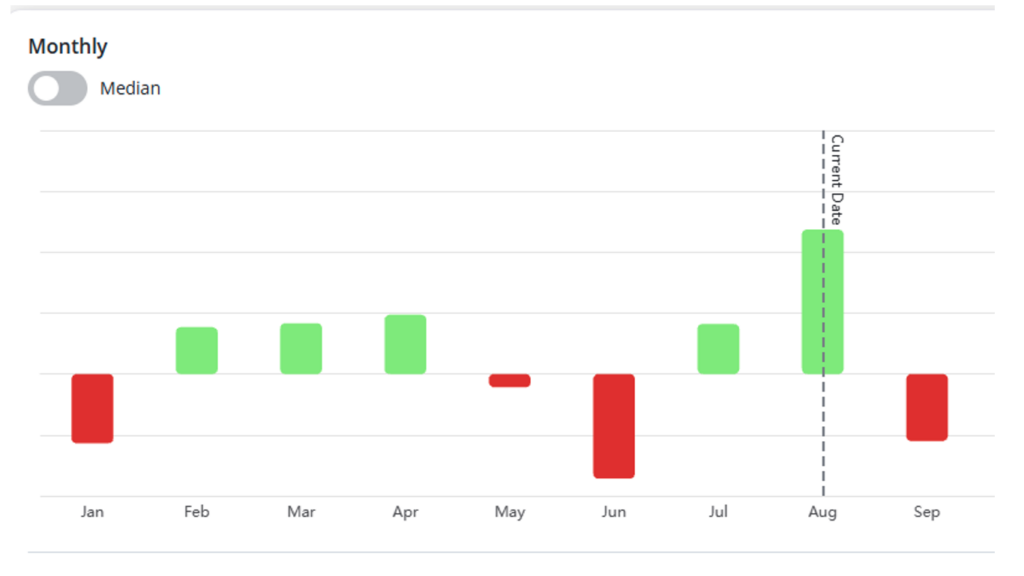
As you can see, it shows a negative January, a swing higher, then another weak market in June.
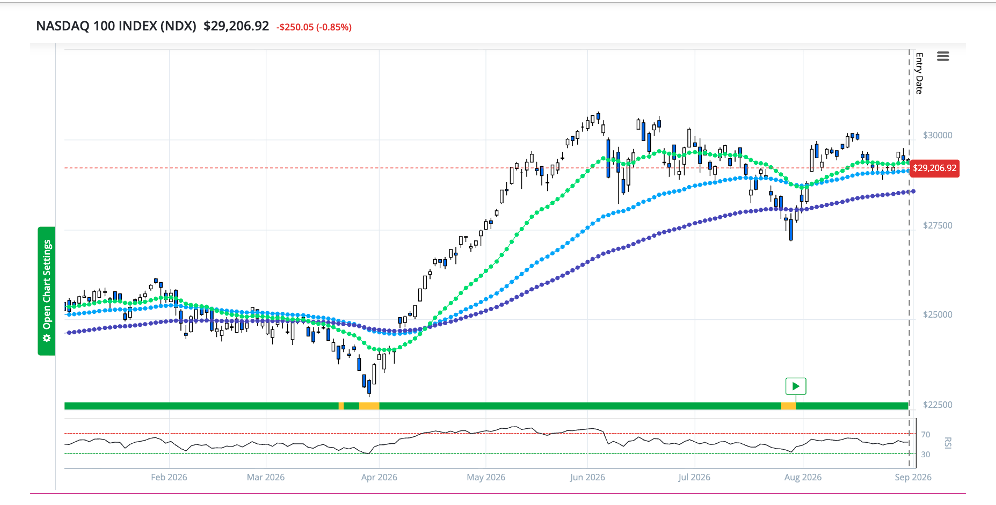
This year didn’t follow the pattern exactly. But we did see the Nasdaq 100 swing higher in April… top out on June 3… then drop again. And it still hasn’t made a new high.
Midterm seasonality is also what allowed me to call the top in semiconductors. Our software shows that SOXX dropped 100% of the time during midterm election years starting June 7 for an average loss of -16.2%.
This year, SOXX topped out on June 22, then dropped -23.8%. That ETF still hasn’t recovered, either.
Now you see the power of seasonality, let’s return to that face-melting rally I see coming in next 30 days that I am exactly 89.5% confident will happen.
Why Stocks Could Rally Through Next Summer
Statistically, the market is due to stop all this frustrating chop on a very specific day: Oct. 1.
Check it out: Over the last 20 midterm election years, the S&P 500 has risen 89.5% of the time between Oct. 1 and Dec. 29. And the average return during this window has been 6.6%.
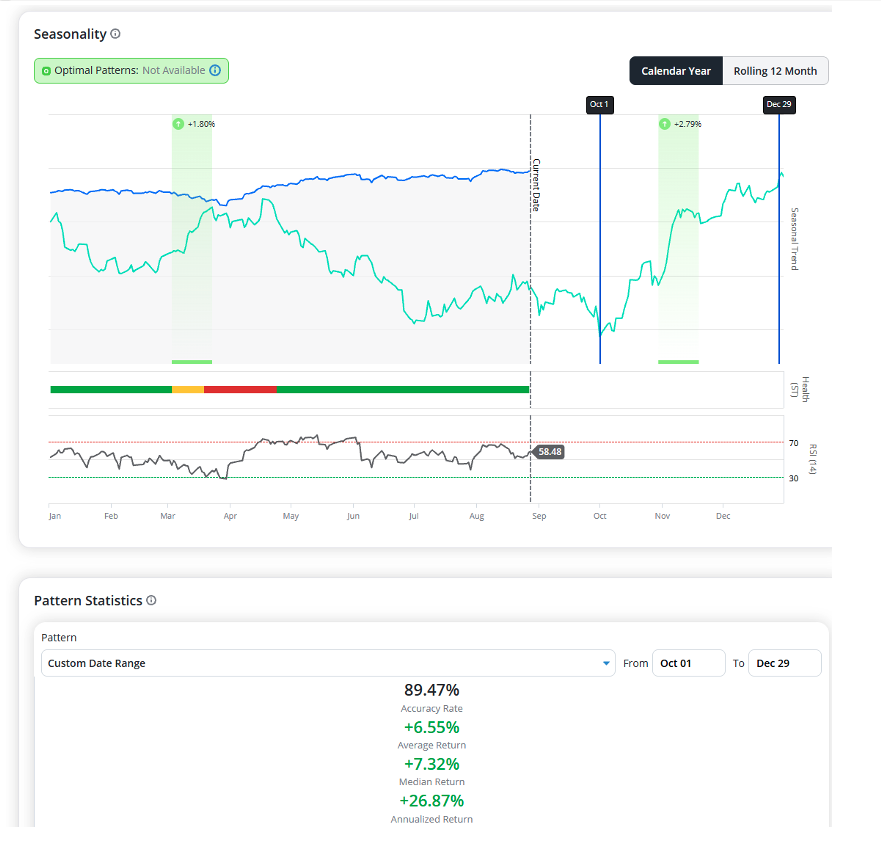
The Nasdaq 100 shows a similar pattern. In fact, all the major stock indexes show a strong rally in October through December.
And here’s the BEST part… based on the election cycle, this rally will likely continue all the way into July of next year.
Look what happens from January into July on pre-election years – which is what 2027 will be…
Over the last 19 pre-election years, the S&P 500 has risen 100% of the time between Jan. 2 and July 14. And the average return in that bullish window has been 13.5%.
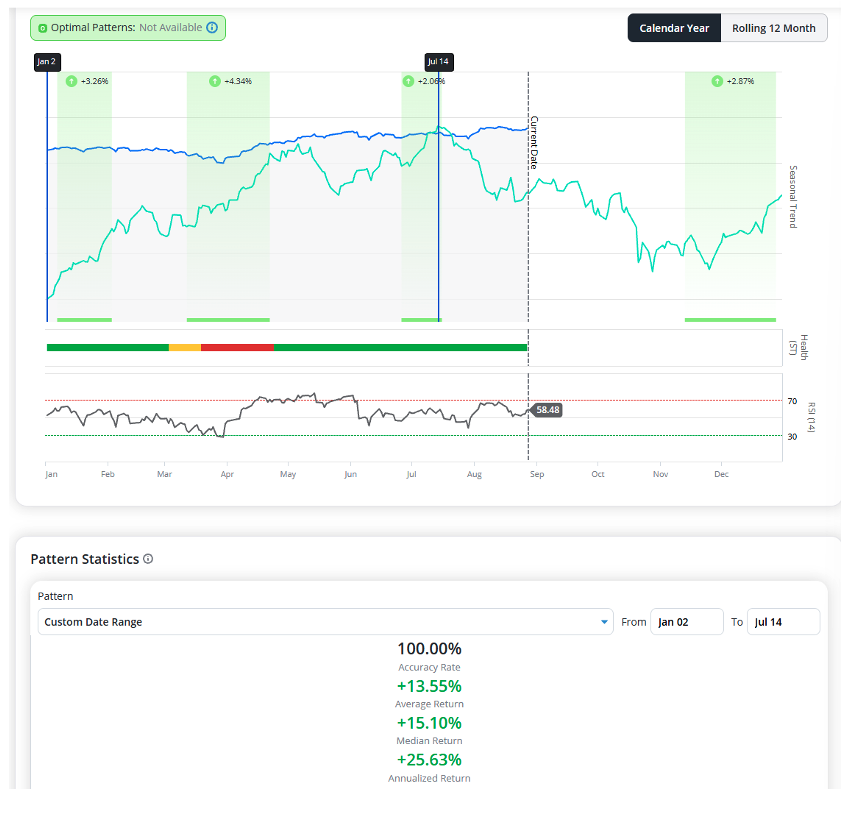
Seasonality patterns aren’t guaranteed to always show up the way they’re supposed to.
But when this year has been adhering so closely to midterm seasonality, then we can’t afford to ignore it when – statistically – stocks are about to turn mega-bullish.
These are some of the strongest signals in our entire database.
How to Prepare for the October Rally
Let’s go back to SOXX. Remember we called the top in June using midterm election seasonality?
Well, now the train looks like it’s heading out of the tunnel. And those days of choppy, two-steps-forward, two-steps-back trading could be over starting Oct. 15.
From then to Dec. 4, SOXX has risen 100% of the time in midterm election years. And during that window, the average return has been 17.4%.
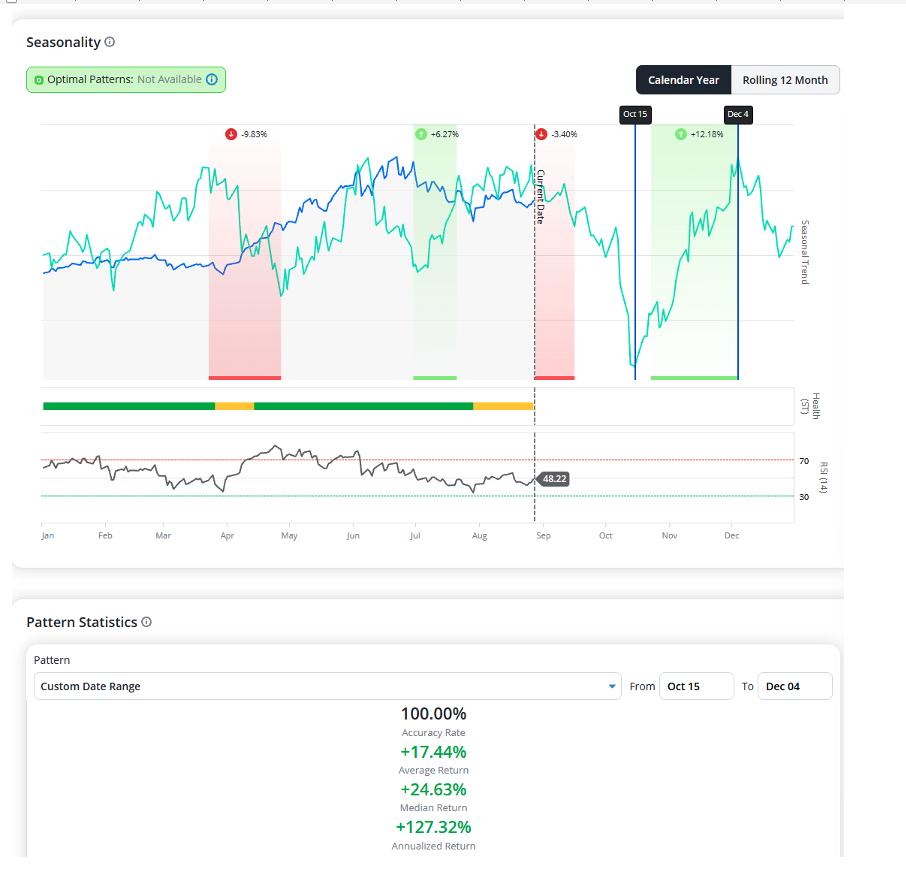
That’s a massive midterm turnaround.
And yes, MU is due to turn around, too…
- That stock’s had an average return of 16.7% during the bullish window October 15 until December 4.
- NVDA’s average return was 27.9%.
- And Broadcom (AVGO) rallied 19.7%, on average.
But this is just the beginning.
In fact, there are so many ultra-bullish seasonal opportunities opening up – not only on the broader indexes and ETFs, but in individual stocks – that it’s a veritable smorgasbord of opportunity. All the choices can get a little overwhelming, though…
What specific seasonal opportunities should you devote capital to?
So, our Chief Quantitative Strategist Mike Carr developed systems to direct you to the select few, absolute best opportunities.
Not only that, you get access to the seasonal windows of every stock in the market… And always know what’s coming down the pipeline next.
Because while most other traders were getting spun around and whipsawed by the market in 2026, Trade Cycles subscribers had it mapped out before the year even started.
The only question is, are you going to be there to ride the new bullish wave?
Monday, Sept. 14 is our next big trade date. To get prepared, watch Mike Carr’s demonstration of our seasonality portfolio system here.
Good trading,
William McCanless
Senior Analyst, Trade Cycles