The Mental Flaw That Costs Investors a Fortune
Listen to the audio version of this article (generated by AI).
I made one of the best stock picks of my career. Then I got in my own way.
In October 2016, before I joined TradeSmith, I bought shares in a struggling chipmaker called Advanced Micro Devices (AMD).
Most people had written it off. The stock was trading for around $7. I’d done my homework, though, and I was convinced the market was undervaluing it.
But a dropdown a couple weeks later spooked me. When it finally crawled back close to what I’d paid, I couldn’t take it anymore. I sold at a 3.5% loss and told myself I’d made the sensible call.
AMD went on to become the world’s second-largest AI chipmaker, right behind Nvidia. From my entry price, it gained thousands of percentage points to where it sits today, north of $510.
That trade could have been one of the best of my life. It’s painful even now thinking about my early exit.
But I’d later learn is that what happened to me wasn’t a personal failing. It’s just how the human brain is wired when real money is on the line.
It turns out the problem isn’t knowledge, experience, or even discipline. The deck is stacked against us at a much deeper level than that. There’s a flaw built into the way the human brain processes losses – one that affects every investor, from the beginner to the professional. And until you understand it, no amount of research or homework will fix it.
Today, I’ll show you what that flaw is, why it’s so hard to overcome, and the simple framework I use to make sure it never costs me a trade like that again.
This Character Flaw Is Wired In
There’s a name for what happened to me with AMD.
In the 1970s, two psychologists, Daniel Kahneman and Amos Tversky, ran a series of experiments that would upend everything economists thought they knew about how people make decisions.
Their finding sounds simple. But it holds the key to solving one of the biggest problems investors face: when to sell the stocks you own.
They discovered that losing money doesn’t just feel bad – it feels roughly twice as bad as gaining the same amount feels good. Lose $100 and the pain you feel is about twice as powerful as the pleasure you’d get from winning $100.
They called this loss aversion. And it’s not a character flaw or a sign of weakness. It’s wired into us at a level that goes far deeper than investment experience or financial education.
Now think about what loss aversion does to an investor watching a stock drop 20%.
The rational part of your brain knows a 20% pullback in a volatile stock is normal. It happens all the time. It doesn’t mean you were wrong. But the emotional part of your brain – the part that evolved over millions of years to treat any kind of loss as a threat – is screaming at you to get out.
And here’s where it gets really costly.
Most investors focus on how much they could gain from an investment so they hold on in the hope that things will turn around. They don’t stop to think carefully about the mathematics of what happens when they lose.
The numbers are brutal.
If your portfolio drops 10%, you need an 11% gain just to get back to where you started. Lose 25%, and you need a 33% gain to recover. Lose 50% – the kind of loss investors suffered in 2008 and again briefly in 2020 – and you need a full 100% gain just to get back to even.
You have to double your money just to get back to where you started.
This is the math your broker will never put on a chart for you. And it’s why avoiding large losses isn’t timid or overly cautious. It’s the most important thing a long-term investor can do.
How to Get Out of Your Own Way
Knowing about loss aversion doesn’t cure it. I still feel the same pull I felt with AMD every time a position moves against me. What changed is that I stopped relying on myself to make that call.
That’s where TradeSmith’s Health indicators come in.
Long-Term Health was the first indicator we developed. It’s built around a simple observation that every stock has a normal range of movement, a well-defined rhythm of ups and downs. Our software measures that rhythm and tracks whether today’s price action is normal or extreme by historical standards.
If a stock is moving higher and remains within its usual range, it’s in a Green Zone. Its trend is intact, and any downside moves – however they might feel to someone holding that position – aren’t a concern.
If it moves outside its normal range, it enters a Yellow Zone – meaning caution – and then a Red Zone. That signals the trend has broken down, and it’s time to sell.
Had I been using Long-Term Health with AMD back in 2016, I wouldn’t have sold at a 3.5% loss. The system would have told me the trend was still intact – that what felt unbearable was just normal volatility.
But the market has changed since we built that tool. The stock market is more volatile than it’s ever been. The 20 largest single-day point swings in market history have all happened since 2020. Crashes that used to unfold over months now happen in days. The 2008 financial crisis took 18 months to play out. The Covid crash took about a month. The 2025 Tariff Tantrum lasted four trading days.
In a market that moves that fast, you need a more sensitive early-warning system. So we built one. Short-Term Health uses the same traffic signal logic as Long-Term Health. But it’s tuned to catch momentum shifts much earlier – designed to be sensitive to even the slightest bearish tremor.
Think of it this way: Long-Term Health is for your core, buy-and-hold positions – the investments you’re building wealth with over years. Short-Term Health is for anything you’re holding for weeks or months, or anytime the market is behaving the way it has been lately.
Together they answer the question loss aversion never lets you answer clearly on your own. Is this a normal pullback, or is the bullish momentum breaking down?
So where do things stand right now with the market?
Follow the Green Lights
I pulled up our Health indicators for the major U.S. market indexes this week.
Every one of them is in a Green Zone on both Short-Term and Long-Term Health. Short-Term Health tells you where any asset stands relative to TradeSmith’s proprietary algorithm. It is designed with the anticipation of holding for a couple of months, while Long-Term Health anticipates holding for 12 months or longer. Most have been there for two to three months.
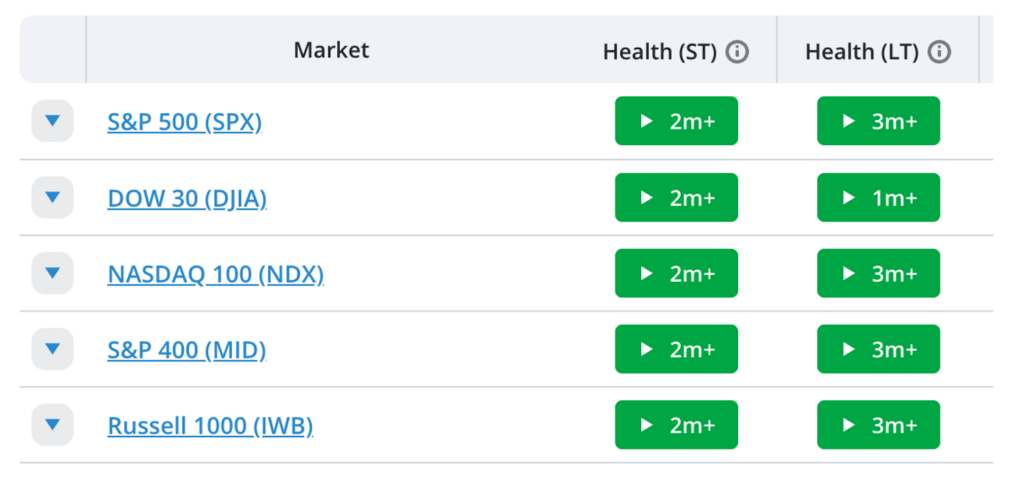
That doesn’t mean the market can’t sell off tomorrow. Valuations are stretched – and history shows us that big booms on the way up lead to steep downdrafts on the way down. What it means right now is that the trend is intact. The evidence says stay invested and back the bullish momentum, not fight it.
We’ll be watching these indicators closely. The moment either one starts flashing yellow or red, you’ll hear from us. Until then, the data is telling us to trust the green light.
All the best, and have a fantastic Fourth of July weekend,

Keith Kaplan
CEO, TradeSmith