These Stock “Quirks” Are a Hidden Path to Profits
Listen to the audio version of this article (generated by AI).
In This Digest:
- Why our revolutionary trading tool treats no two stocks as the same
- Try it out for free before Wednesday’s launch event
- These stocks have entered Green Zones – here are the standouts
More mixed messages out of Iran…
On Friday, Iran’s foreign minister posted on X that the Strait of Hormuz — which carries about a fifth of the world’s oil — was “completely open.”
Traders celebrated the news.
The S&P 500 hit a new all-time high. It’s now up more than 12% since March 30.
And Brent crude oil, the international benchmark, fell about 9% to around $85 a barrel.
Then came the weekend.
After the U.S. refused to lift its naval blockade, Iranian gunboats forced passing ships to turn back at gunpoint.
On Saturday, two Revolutionary Guard gunboats opened fire on the Sanmar Herald, an Indian-flagged supertanker carrying 2 million barrels of Iraqi oil.
And on Saturday night, Iran declared the Strait closed again — warning that any approaching vessel would be “considered cooperation with the enemy.”
As of this writing, Brent crude oil is back up 4.5% and stocks are heading lower.
How do you navigate this kind of whiplash market?
By tuning out the noise and focusing on the signal instead.
Over the past year, the team at TradeSmith has been developing a new type of trading system that ignores the news… and focuses only on what matters.
Instead of trying to figure out what’s happening in the world, it produces high-probability trade setups based on unique “behavioral” profiles of more than 2,000 U.S.-listed stocks.
You can test it out for free here – ahead of Wednesday’s launch event.
It’s unlike anything most investors have access to. But as we’ll get into today, it’s been a favorite technique of one of Wall Street’s more storied hedge funds, Renaissance Technologies.
It averaged gross annual returns of 66% for four decades… 39% after fees. The fund became so successful that, in 2005, its founder returned all the money investors had given him to manage so he could keep all the profits for himself and his team.
And its secrets have stayed locked up at it and a handful of other Wall Street firms… until now.
It all began in a cramped office in a Long Island strip mall…
In 1982, a mathematician and Cold War codebreaker named Jim Simons left his tenured position running the math department at Stony Brook University.
Simons wanted to apply his math skills to the markets. So he rented an office in a strip mall close to the university and started a trading firm.
Located beside a pizza joint, it was about as far from the glitz and glamour of Wall Street as possible. And that wasn’t the only thing that was unusual about Simons’ fledgling firm.
He wasn’t interested in earnings reports or analyst forecasts. He knew that the crowd was already focused there. And chasing those same ideas in the same ways wouldn’t help you beat the market.
Instead, he began looking for obscure, repeating “signals” buried in market data that pointed to statistically predictable price moves.
Even stranger, Simons and his team didn’t treat every stock the same. He was looking for signals that were unique to each individual stock he traded.
It’s a whole new way of looking at the market…
There are two main ways to analyze stocks.
One is fundamental analysis. That’s when you look at what a company’s balance sheet and its earnings reports to find out what it’s worth. Then you figure out if the market is pricing it correctly.
Warren Buffett made this method famous and proved it works with an average compounded annual return of 20% from 1965 to 2024 versus about 10% for the S&P 500.
Then there’s technical analysis. There you look at how a stock is trading, rather than what the business is doing.
Then there’s a third game-changing approach that we’ve been working on at TradeSmith, inspired by Simons.
Where fundamental analysis asks what a company is worth and technical analysis asks how it’s been trading, our approach asks something different entirely.
How does this specific stock behave… and when does that behavior signal a big move?
We call it Behavioral Profile Analysis…
It’s based on the simple observation that every business in the world is unique.
This means every stock has its own way of behaving… and its own way of reacting to what happens in the economy and the markets.
For example, an IT company like Oracle (ORCL) will behave differently than an investment manager like Invesco (IVZ). And a big drug company like Pfizer (PFE) will behave differently than a semiconductor equipment company like Lam Research (LRCX).
When you look at the markets this way, stocks start to look more like people than tickers. Each one has its own behavioral patterns — its own habits, tendencies, and quirks.
The same economic event hits two companies differently. The same market development triggers two different reactions.
And underneath it all, each stock leaves behind a distinct trading “thumbprint.” It’s unique way of moving based on factors that have aligned in the past.
The problem is most of those thumbprints are invisible to the human eye.
That’s why the system we developed uses AI to evaluate 2.09 million potential trades every day across 2,467 stocks. It runs each one through hundreds of calculations, looking for the specific combinations of factors that have historically preceded big moves.
Take the trade on Invesco (IVZ)…
It’s one of the world’s largest investment management firms.
In our testing, two factors had to align for this signal to fire. The stock’s Bollinger Percent B and its Money Flow Index both had to exceed 80.
Bollinger Percent B measures where a stock’s price sits relative to its recent trading range. The Money Flow Index tracks whether money is flowing into or out of the stock. Both operate on a scale of 0-100.
Don’t worry if you’re not familiar with these metrics – or the combination of the two. This is the kind of pattern no human analyst would ever think of looking for.
But we found this was a strong buy signal. And on one trade back in July of last year, this IVZ signal produced an 18.8% gain in 11 days.

That’s more than the S&P 500 typically gains in a year.
Or take Lam Research (LRCX)…
It’s one of the largest makers of semiconductor manufacturing equipment.
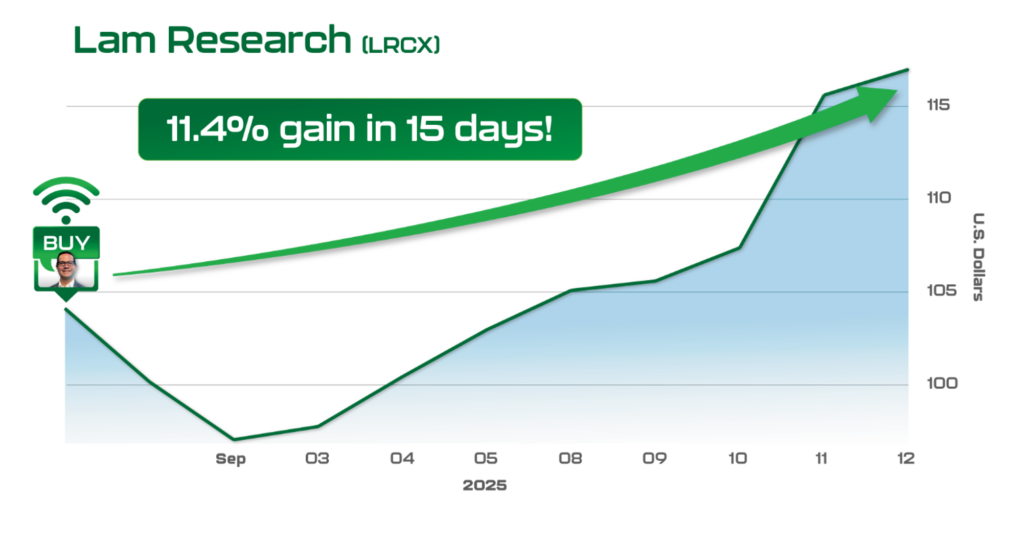
For its signal to fire, the stock had to close above its 200-day moving average. And that close had to fall two trading days before a market holiday.
That’s it. Nothing about the company’s earnings. Nothing about the semiconductor sector. Nothing about the broader market. Just a price condition and a calendar condition, lining up at a specific moment.
This is not the kind of signal that makes intuitive sense to most people. But it makes perfect sense to our algorithms.
When the signal fired on Aug. 28, 2025 – two trading days before Labor Day – LRCX gained 11.4% in 15 days. The historical accuracy rate behind that signal was 86%.
And these returns are from trading our signals with stocks. Here’s what those same signals produced using options:
- Caterpillar (CAT): 126% in 72 hours
- Nvidia (NVDA): 129% in 5 days
- Lockheed Martin (LMT): 365% in 30 days
- HCA Healthcare (HCA): 461% in 13 days
- Generac (GNRC): 1,082% in 33 days
Given how chaotic it’s been for buy-and-hold investors in 2026, this kind of system matters now more than ever.
Because it’s looking for factors that have aligned before ahead of big moves in stocks, it doesn’t care whether we’re in a bull or a bear market. It doesn’t need a calm geopolitical environment. It just needs certain factors to align.
This Wednesday, April 22 at 10 a.m. Eastern, our CEO, Keith Kaplan is hosting our AI Signals Trading Event.
He’ll walk you through how the system works, the signals it’s tracking right now, and the trades it’s flagging for the weeks ahead.
That means you still have two days to test drive our software…
When you register for the event, you’ll get access to a beta version to try out for yourself.
You can look at the top five signal trades for each day. You can also type in any ticker to search for active signals on stocks you want to trade.
And there’s something else slated for Wednesday. It’s when the two-week ceasefire with Iran ends. So by the time the event kicks off, we could be looking at a very different market.
That’s why I hope you’ll join Keith for the launch event. This system doesn’t depend on the Strait reopening or an end to the war. It doesn’t care if stocks go up, down, or around in circles.
It completely ignores the news and lets math, probabilities, and AI-powered pattern recognition give you an edge instead.
Get the full details of Wednesday’s event right here.
These stocks have entered Green Zones – and here are the standouts…
Despite ongoing concerns over the war with Iran, we’re seeing a wave of buy signals fire across the market.
Stocks are entering Short-Term Health Green Zones – a sign that a new short-term uptrend is in place.
What makes this batch especially compelling is that many of these stocks were already in their Long-Term Health Green Zones. Their long-term trend was already healthy. Now their short-term momentum has turned positive, too. That’s a powerful combination.
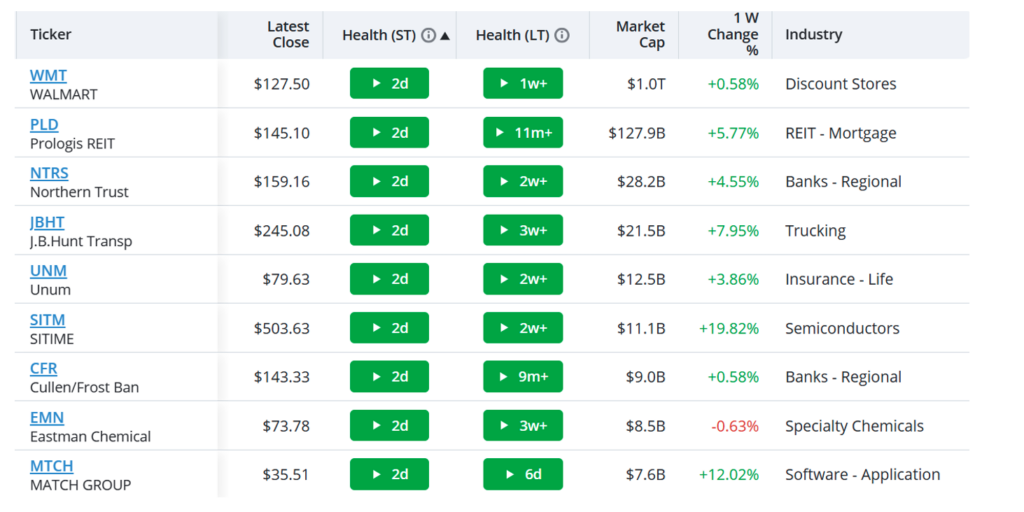
Here are the latest signals across the S&P 500, Nasdaq 100, and Dow – along with the mid-cap S&P 400 and small-cap S&P 600. All of these triggered on Friday, April 17:
Several stocks stand out with one-week price gains that well outpace the market.
- SiTime (SITM) leads the pack with a 19.8% gain over the past week. SiTime makes precision timing chips – components that keep electronic devices synchronized – used in everything from 5G networks to data centers.
That nearly 20% weekly surge came on the back of the broader semiconductor rally, and the stock just flipped into a Short-Term Health Green Zone while its Long-Term Health has been Green for more than two weeks. That’s a strong combination of momentum signals worth noting for a mid-cap tech firm.
- Match Group (MTCH) is up 12.0% in the past week – a big move for a dating-app giant many investors had written off. The dating-app giant has been a strong outperformer since the broader market bottom at the end of March, with the price rebounding more than 20%. Friday’s buy signal suggests the short-term momentum has legs, with a new Long-Term Health signal flashing just ahead of it.
- J.B. Hunt Transport Services (JBHT) gained 8.0% on the week, entering a Short-Term Health Green Zone while its Long-Term Health has been Green for more than three weeks. As a bellwether for freight and logistics, JBHT’s uptrend suggests that despite higher fuel prices, demand for domestic shipping is strong – which could be a good sign for the underlying economy.
- That last signal pairs well with Prologis (PLD), the largest industrial real estate investment trust in the world. That’s up 5.8% on the week with a Short-Term Health Buy signal and a Long-Term Health Green Zone that stretches back 11 months. When the biggest owner of warehouse and logistics facilities in the world is in a sustained uptrend, it helps confirm that supply chains are healthy.
All of these new buy signals are worth tracking, especially as the rest of the market chops up and down trying to make sense of the Iran War.
To building wealth beyond measure,
Michael Salvatore
Editor, TradeSmith Daily