These Two Oil Stocks Are a Buy, No Matter What Comes Next in Iran
Listen to the audio version of this article (generated by AI).
In This Digest:
- Two oil stocks to buy, no matter what’s happening in Iran
- A new AI chokepoint stock for your radar
- Wall Street is missing an upsurge in consumer demand…
Weeks before the latest Iran news, our software flagged these two oil stocks…
Yesterday, President Trump said he was blockading the Strait of Hormuz once again.
This comes after the U.S. struck about 140 military targets across Iran – and Iran launched missiles and drones at targets in the UAE, Qatar, Kuwait, Oman, Jordan, and Bahrain.
Here at TradeSmith, we have no idea how the war will end… or when. And no matter what they tell you, neither does anyone else.
So instead of trying to guess the future, we’d rather understand past patterns in the data.
Weeks before the fighting heated up again, our Seasonality tool was flagging mid-July as one of the strongest stretches of the year for two American oil refiners.
If you’re new to Seasonality, it looks back over decades of market data to find consistent times throughout each year when a stock has tended to rise or fall. That’s not a guarantee that the same pattern will happen again. But it stacks the odds of success in our favor.
And right now, two refiners are in one of those rising windows.
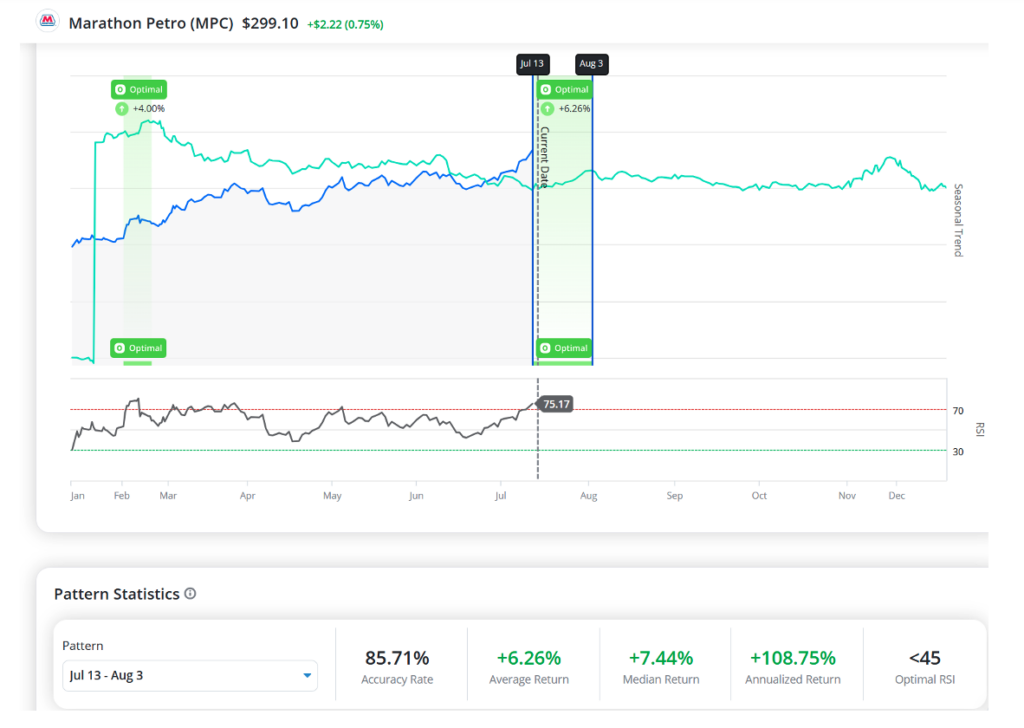
The first is oil refiner Marathon Petroleum (MPC). Its bullish window runs from July 13 to Aug. 3. Over the past 15 years, it’s finished higher during this window 85.7% of the time, with an average gain of 6.3%.
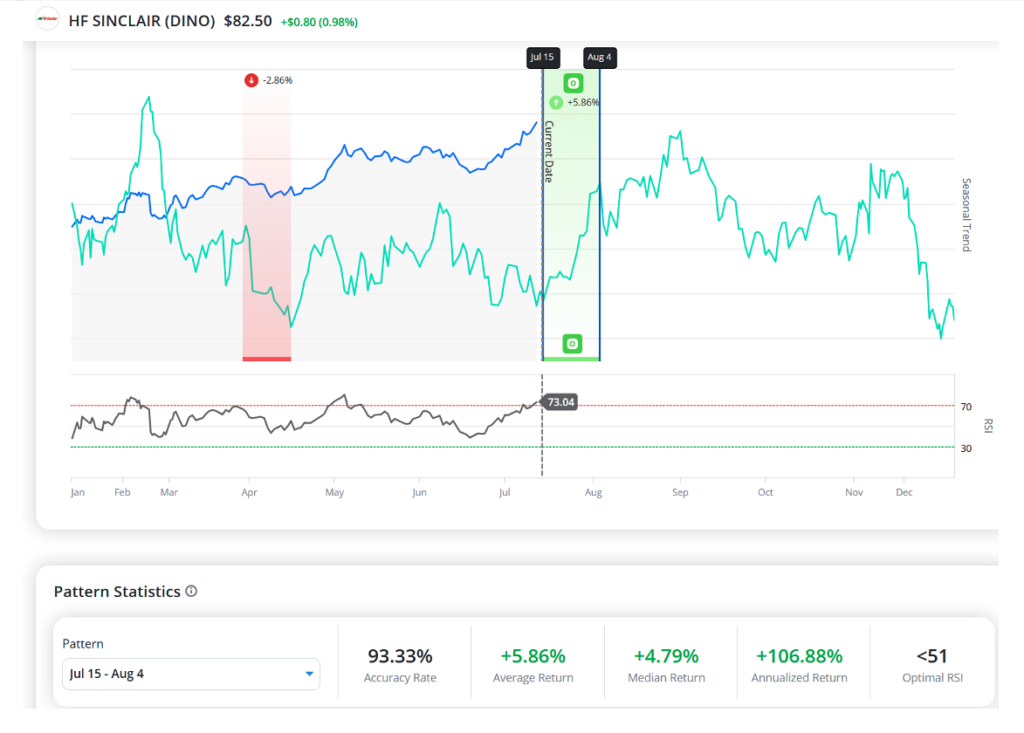
The second is fossil fuel refiner HF Sinclair (DINO). Its window opened on July 15 and runs through Aug. 4 – and it’s been even more reliable. DINO has made gains during this window 93.3% of the time, with an average gain of 5.9%.
With our Seasonality software, you could’ve known about these bullish windows back at the start of the year… along with dozens more like them.
These tend to hold with remarkable consistency year after year, no matter what the market is doing. Which means you can focus on the windows with the strongest historical accuracy rates and ignore the news headlines.
For the next couple of days, we’re giving every TradeSmith Daily reader access to an “unlocked” version to try out. You can use it to check seasonality patterns on stocks you already own – or ones you’re thinking about buying.
Then on Thursday at 10 a.m. ET, our CEO, Keith Kaplan, will walk you through the seasonal windows that matter most for the rest of this year – including one opening up right now on one of the market’s hottest AI stocks.
To unlock the Seasonality software and grab your spot for Keith’s event, go here.
A new AI chokepoint stock for your radar…
Here in South Florida, it’s pushing 95 degrees. Other areas of the East Coast are clearing 100 degrees, as the summer “heat dome” continues.
Normally, that’s a problem for the grid, as millions of people crank their A/C units to the max.
These days, it’s also a threat to AI.
Every AI query and generated image runs through servers packed with advanced chips that need constant cooling to keep them from burning out.
The only problem is that the kind of cooling equipment AI data centers need is hard to find.
Chillers – the big machines that pump cold water through a data center to keep servers from overheating – now take 20 to 30 weeks to arrive after they’re ordered. The pumps that move that cooling water can face similar waits, because the same handful of manufacturers also supply pumps to factories and drugmakers, and everyone’s ordering at once.
That’s a serious problem when a single day of downtime at a major data center can cost millions of dollars.
So it’s no wonder that water technology company Xylem (XYL) has hit a 1-month high.
Xylem makes the pumps and water-treatment systems data centers depend on to keep cooling water flowing around the clock. As AI data centers get built faster than that equipment can be manufactured, companies like Xylem sit in the middle of one of the tightest bottlenecks in the entire AI buildout.
Does that make Xylem a good buy today?
To answer that, let’s look at its Quantum Score.
Xylem has a Fundamental Score of 91.4, meaning its business is firing on all cylinders. But its Technical Score is just 50. This part of the score looks at a stock’s momentum and whether it’s on the receiving end of unusually large inflows from institutional investors. A score of 50 suggests this one’s still flying under the radar even at a 1-month high.
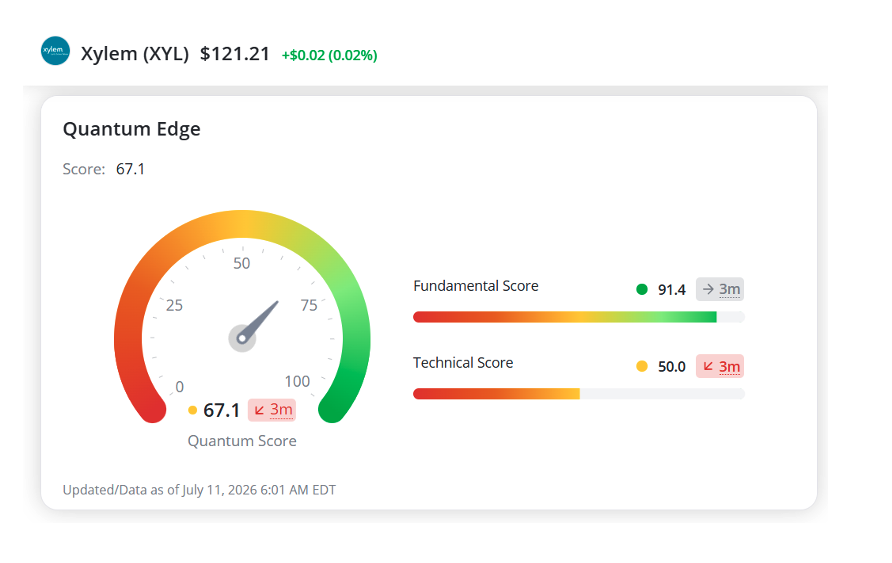
So think of this as an early-stage idea: a strong business that controls a vital AI chokepoint that’s showing the first flickers of momentum.
One way to trade an idea like this is to start with a small position and add to it as the Technical Score strengthens – a sure sign big Wall Street players are getting involved.
If you’re a TradeSmith subscriber, search for ticker XYL and keep an eye on how its score progresses.
Wall Street is missing an upsurge in consumer demand…
Retail stocks have been taking it on the chin of late. But our colleagues Andy and Landon Swan say investors are out of step with consumers.
If you don’t know them already, the Swan brothers created the Social Heat Score. It scans millions of signals across the web – from search activity to social media posts to AI queries – and rolls them into a single score for hundreds of companies.
One component of this score is consumer demand, which Andy and Landon compile from a range of web-based sources, including page visits and social media mentions.
And right now, the data suggests shoppers are showing up in force, even as the stocks lag.
Start with the mall.
For years, the story was that brick-and-mortar retail was dying.
But demand data (green bars on the chart below) is up, despite falling stock prices (red bars).
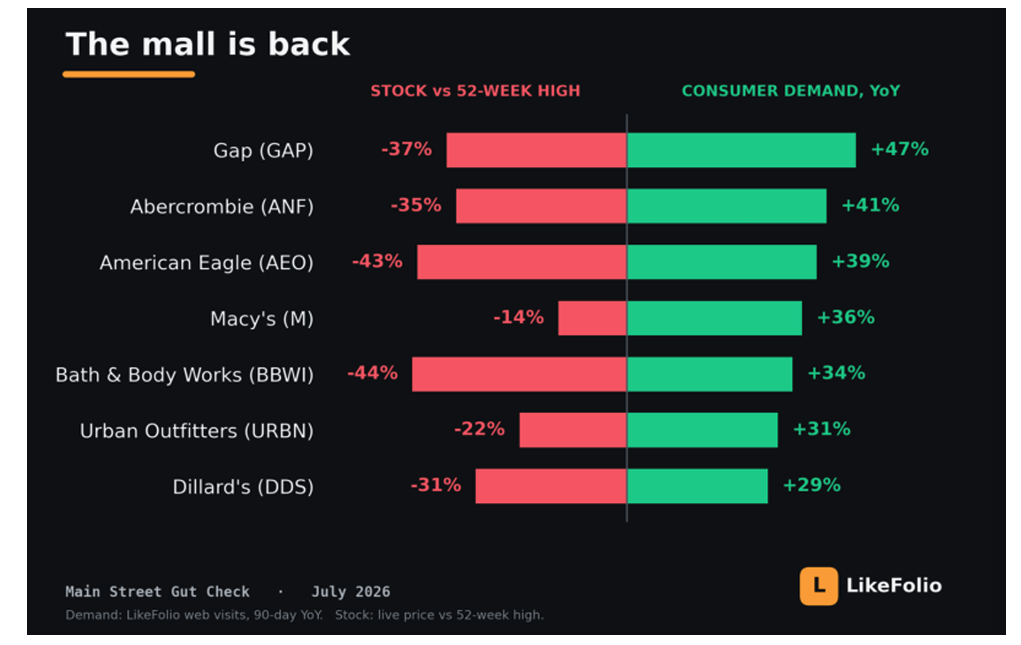
As just one example, consumer demand for clothing retailer American Eagle (AEO) is up 39% over the last year, despite the stock dropping 43% from its 1-year high.
The same pattern is playing out with discount retailers…
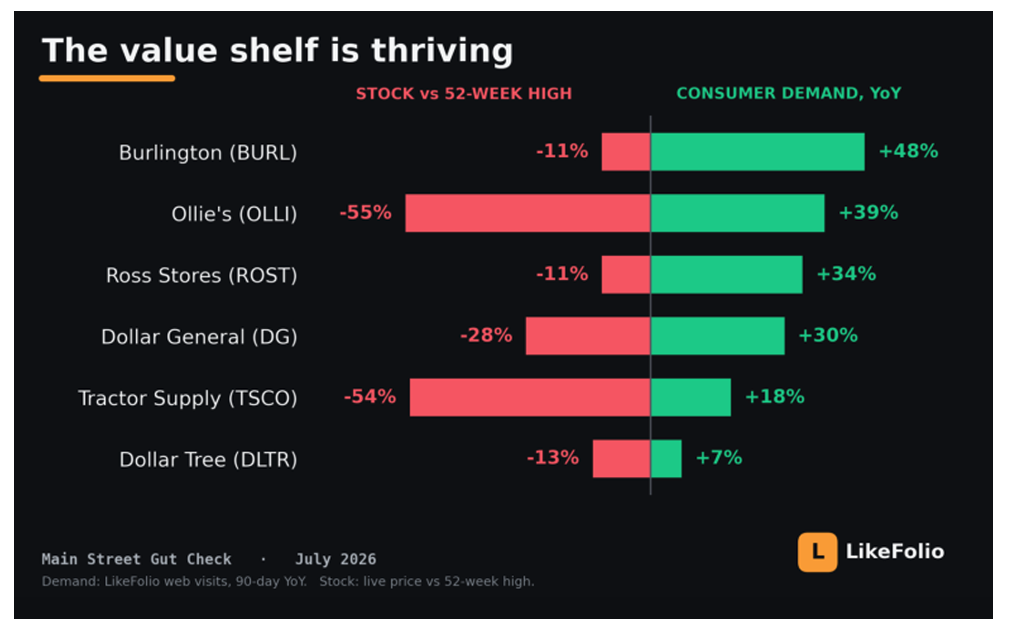
Burlington (BURL), the off-price retailer, is seeing demand up 48% while the stock sits 11% below its high.
Ollie’s Bargain Outlet (OLLI) shows the widest split of the group: Demand is up 39%, but the stock a full 55% below its high.
The same is true of luxury spending…
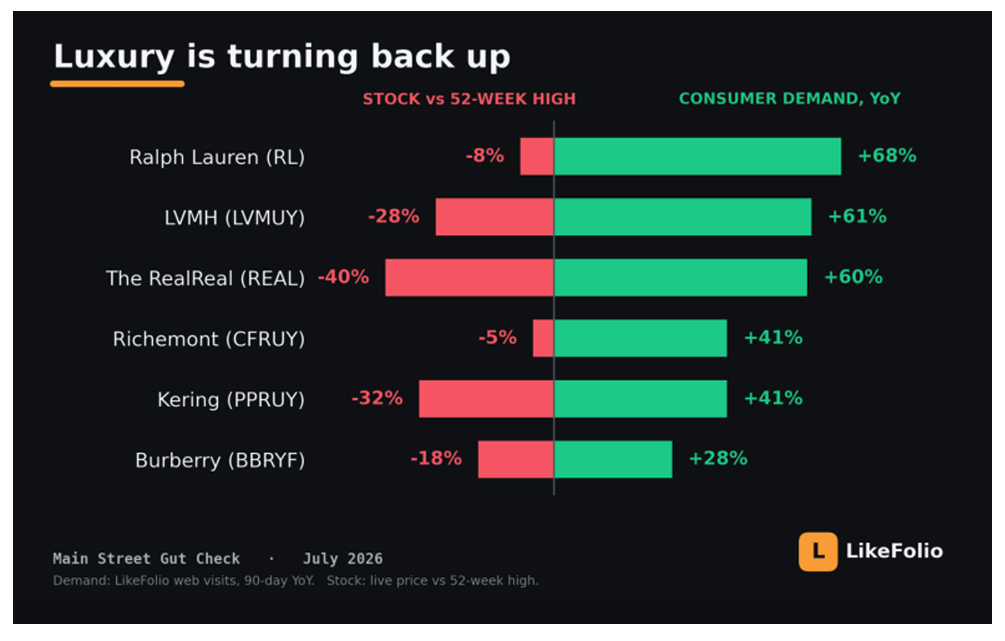
Ralph Lauren (RL) leads the group with demand up 68%, even as the stock trades 8% below its high.
LVMH (LVMUY), the owner of Louis Vuitton, shows demand up 61% with the stock still 28% below its high.
And The RealReal (REAL), the luxury resale marketplace, has demand up 60% while its stock sits 40% below its high, one of the widest divergences in the entire report.
Andy and Landon love to see disconnects like this.
Because Main Street demand doesn’t always move in lockstep with Wall Street’s favorite metrics. Sometimes consumers move first… and fundamentals catch up later.
Some of the best opportunities emerge when consumer demand and stock performance temporarily diverge, creating a window before the broader market fully catches on.
If you’re a MegaTrends subscriber, it’s worth checking out their new Main Street-focused research report that delves deeper into these consumer trends, along with several others worth any investor’s close attention.
To building wealth beyond measure,
Michael Salvatore
Editor, TradeSmith Daily