This AI Stock Just Fired Two Powerful Buy Signals
Listen to the audio version of this article (generated by AI).
The mood on AI stocks has soured these past few weeks.
Many of the top themes inside of the AI trade – memory, optics, and power – have all struggled lately.
Memory giant Micron (MU) is down 17% in just over a week. Optics stock Corning (GLW) is down 20% in the same span. And popular, volatile AI energy stock Bloom Energy (BE) is down more than 22%.
Some will chalk up the rough stretch to an inflation battle.
Both oil prices and yields have flared dramatically… with the latter seeing the 10-year and 30-year Treasury yields reaching their highest levels in almost 20 years.
Others will paint the AI trade with a red brush, given the recent report that OpenAI’s annualized revenue is about $20 billion lower than previously reported…
All this bad news has rattled investor sentiment in the year’s best-performing stocks.
Now, we shouldn’t dismiss these concerns. They’re real. We should always factor important information into our next moves.
But we also can’t make brash decisions on the market’s most important megatrend.
There are plenty of smart moves to make on the buy side right now – high-quality companies are on sale suddenly.
And TradeSmith’s data helps us find these setups.
TradeSmith’s Signals helps you to spot and study all kinds of historical anomalies… allowing you to cut through the clutter of noisy headlines.
On top of the dozens of AI-tested signals we provide… and our Signals Master Portfolio, which cycles through them all and has gained a compounded annual return of 54% over an 6-year backtest… one of my favorite tools is the Signal Study Builder.
There you can set your own parameters and test what’s happened when stocks hit certain conditions in the past.
One of my favorites looks at stocks experiencing consecutive falling days.
For one unbeatable AI stock in just this same condition, history says double-digit gains are likely ahead in just a few months.
I’ll show you what I found in just a moment.
But first, let me show you why this kind of signal is so powerful…
This AI Stock Just Fired an Undefeated Buy Signal
Let’s rewind the tape to 2024.
Headlines hit that the S&P 500 tracking ETF (SPY) fell 6 days in a row – a rare signal.
The assumption was that the market action was so bearish and so uncommon, more pain was set to follow.
We didn’t assume anything. Instead, we asked: What happened in the past when the S&P 500 fell six days in a row?
The answer was simple. Since 2008, stocks were always higher a year later. And that winning streak held. A year later, SPY was up 10.8%.
Today we find another unique setup with a core AI company, Lam Research (LRCX).
Lam Research is a major wafer fabrication equipment player. They have the specialized machines that build advanced computer chips.
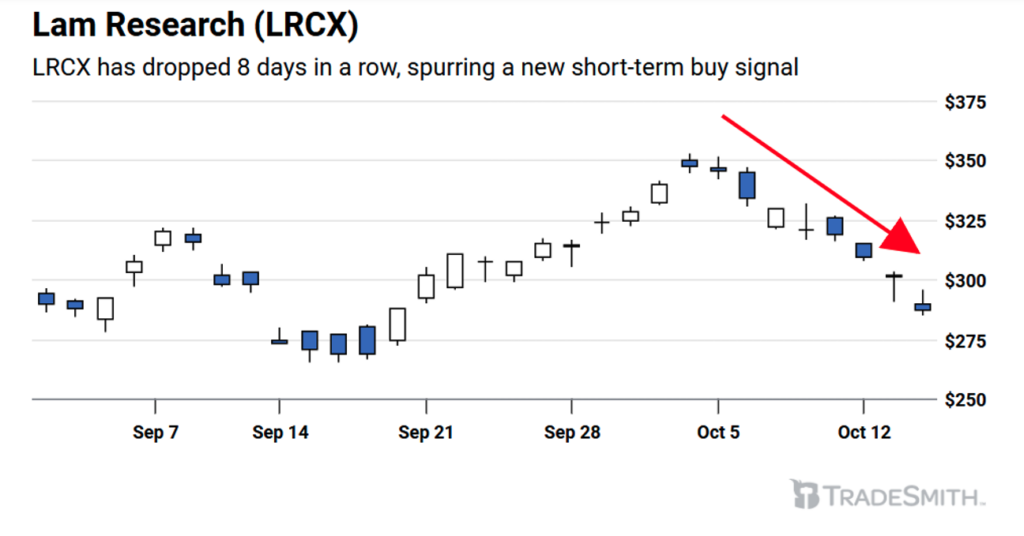
LRCX just fell 8 consecutive days, something it hasn’t done since 2015:
Now, what makes this an interesting idea is twofold.
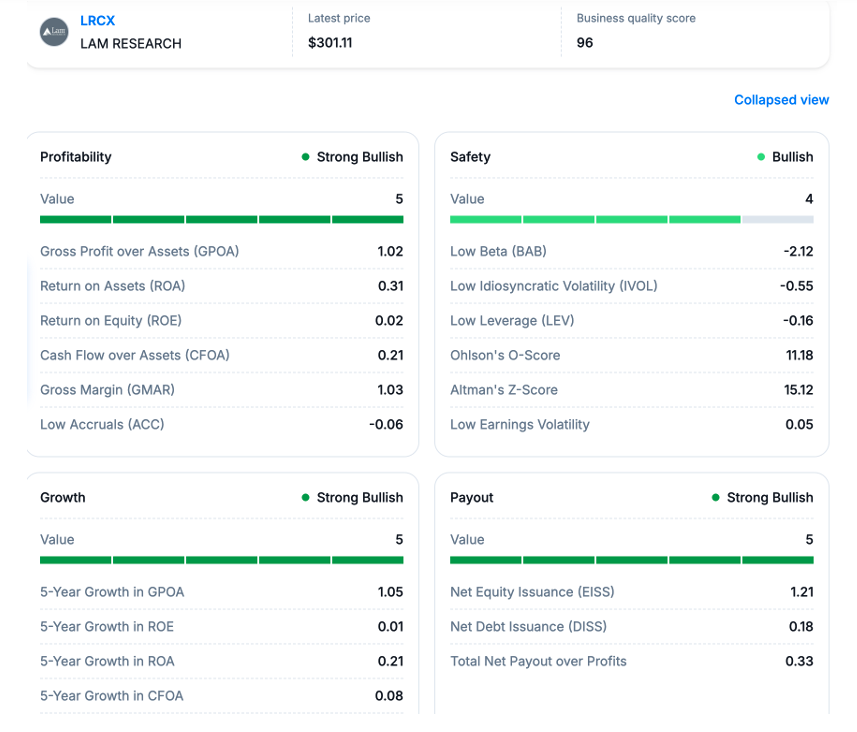
First, Lam Research has an incredible fundamental profile. As you can see below, TradeSmith’s Business Quality Score rates LRCX at 96!
Based on four metrics including Profitability, Safety, Growth, and Payout – Lam is an all-star company on paper:
But another factor that makes this a compelling trade idea today is the fact that the stock has fallen 8 days in a row.
This rare signal has occurred just three times in the past.
- One month later, the stock gained 7.4% on average with a 67% win rate.
- Even better, three months later, LRCX jumped an average of 33.5% with a 100% win rate.
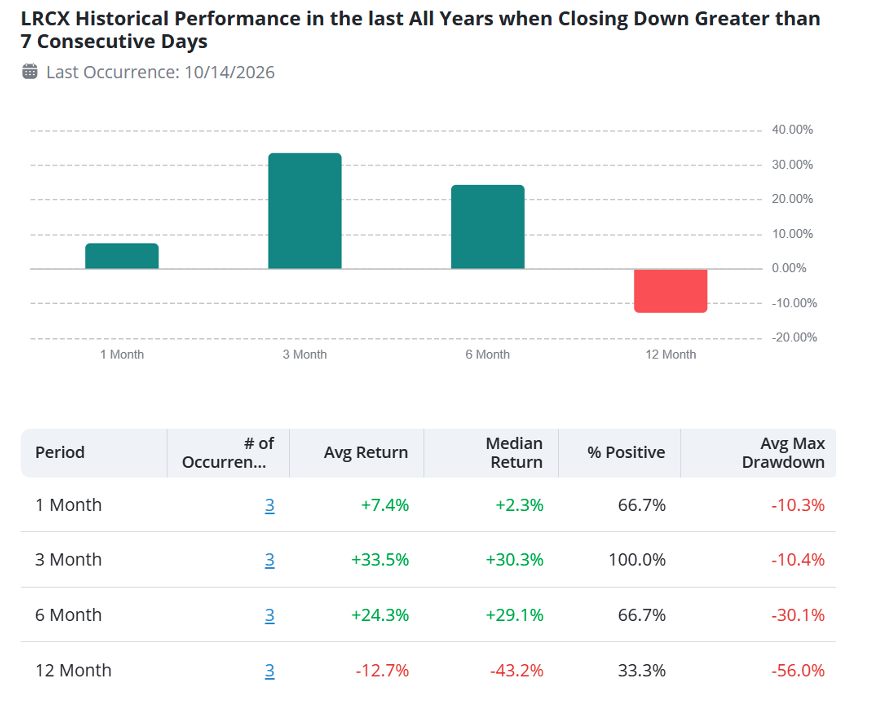
We have seen some longer-term volatility in this signal, with LRCX falling 12.7% on average over a 12-month window. So you’d might want to treat this as a shorter-term trade.
But for the long-term investors, there’s also evidence that the dip in LRCX is worth buying:
Over the eight days that LRCX has fallen recently, it’s gone down nearly 19%. That’s a lot of value to lose in less than two full trading weeks.
But look how that’s played out in the past.
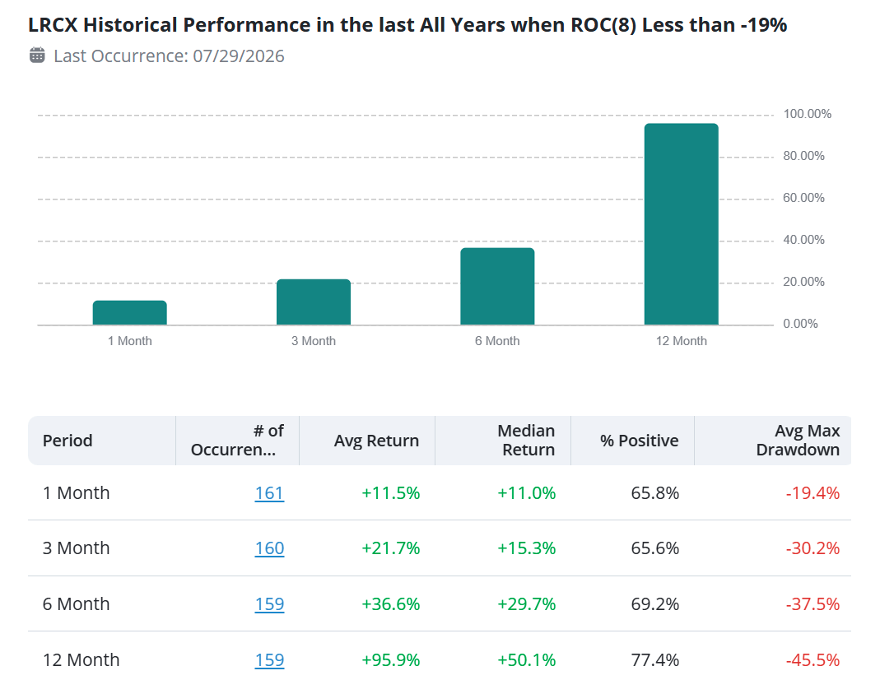
This signal measures the rate of change (ROC) of LRCX – or how much its price has changed over a certain length of time.
It’s a fairly common signal, hitting just over four times a year going back to 1990. The most recent one hit in late July. That’s why there are slightly fewer cases as the time frames grow – some recent hits are still playing out.
But look at those long-term results. After 12 months, looking at 159 separate cases, the stock has been higher 77.4% of the time for an average return of 95.9%.
Now, there is no guarantee of what will happen in the future.
But having cold, hard data will keep the edge on your side.
TradeSmith’s Signals software lets you cut through all the noise and find real opportunities that the headlines always miss.
And we’re constantly updating our software to bring you more signals and more options to build your own.
Don’t let the headlines spook you out of winning trades.
Trust the evidence. Study history. Follow the signals.
Until next time,

Lucas Downey, Senior Analyst, TradeSmith’s Alpha Signals
Disclosure: Lucas owns LRCX personally and in a managed account.