This Seasonal Pattern Called Oil’s Top Before the Headlines
Listen to the audio version of this article (generated by AI).
Michael’s note: This week, I’m talking with William McCanless. He’s the editor of our Trade Cycles service who called the April top in oil… but because of our Seasonality software, was able to make that call all the way back in January.
William walks me through how he saw it coming, why the same signal flagged the top in silver a few weeks later, and one stock on his radar as an actionable idea right now. He’ll also discuss 10 new seasonal trades coming to our Trade Cycles subscribers in August based on our new, revamped algorithm.
If this conversation has you wanting the full picture — the system behind these calls, and where it points from here — our CEO Keith Kaplan built an entire event around it. The Breakthrough 2026 replay is still up, but only for a few more days.
Watch the replay here, and read on for my conversation with William…
Michael Salvatore: William, thanks for joining me.
What I find fascinating about seasonality is that it seems to show up, regardless of what the market looks like on the surface.
And this year has been one of the strangest first halves I can remember – a long, ugly stretch from late February through March, then one of the most powerful win streaks we’ve seen in years. Then just last week, we saw some of the market’s favorite chip stocks absolutely crater.
So let’s start broad: How does seasonality hold up in a market this volatile?
William McCanless: Before we get into that, I have to note that we called this volatility – based on seasonality – back in December of last year.
We said in a subscribers-only webinar that midterm election years have their own very distinct seasonality – that it was going to be choppy and hard to trade all the way into October.
You can see it clearly in this chart of the S&P 500 going back 19 midterm election cycles.
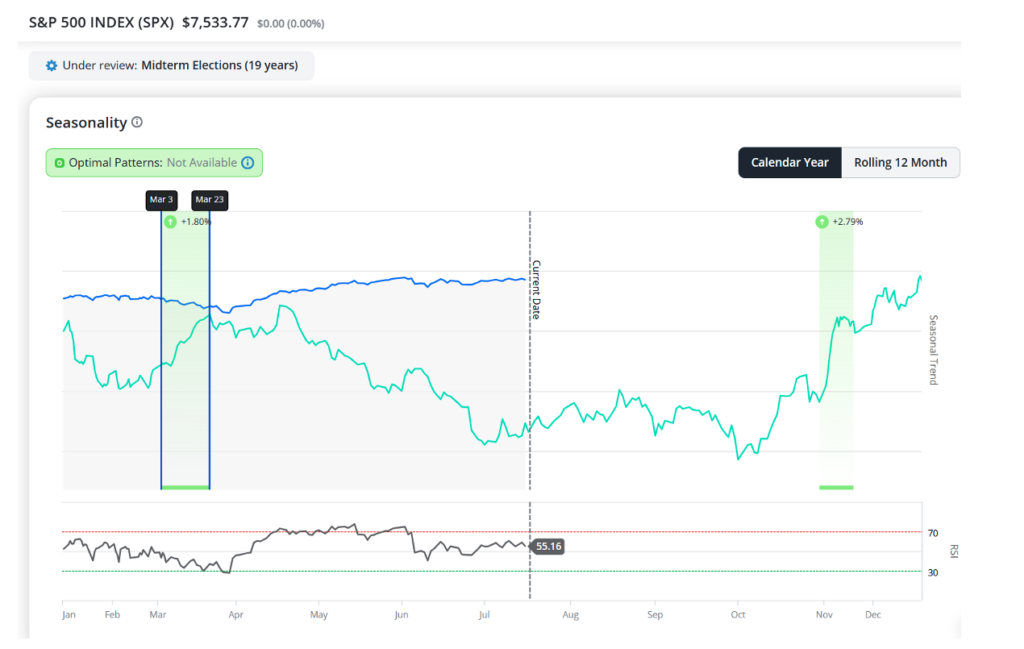
The blue line is this year’s price action, and the green line is the average of all those midterm election cycle years. Taking all these years into account, you tend to get a choppy and volatile first half, a pause in the summer, and then a liftoff from October through the end of the year.
That’s why I told my readers not to get bullish in January and February. That’s counterintuitive, because that’s exactly when most people want to get bullish, and in a normal year the seasonal data backs them up.
But not in a midterm year. Midterm years are choppy early, and that’s precisely what happened – the market fell in February and March.
The other big one: June is historically the weakest month in midterm years, the highest probability of a down move. And we had a rough June.
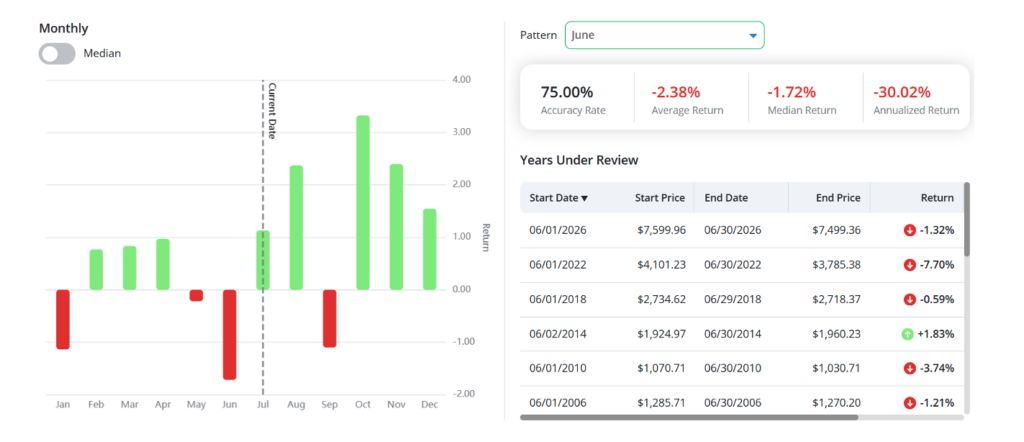
We still haven’t reclaimed the highs from the first week of it.
Michael: That’s a striking thing to be able to say. Between the headlines, the tension with Iran, everything happening in AI – it all makes the market feel impossible to read. And yet you had this mapped out at the end of last year.
William: It doesn’t make it easy to trade – you’re still following a system through a lot of noise. But it does mean you can prepare for a choppy stretch instead of getting blindsided by it. We weren’t caught off guard.
Michael: You mentioned October as the turning point. What can you tell me about the second half of 2026 leading up to it?
William: Honestly? More of the same until October. But October is the payoff.
Look at the last 15 years, the last 100 years, every midterm cycle back to the 1920s – it doesn’t matter which lens you use, October into year-end is about the most bullish stretch of the calendar. In midterm years it’s especially pronounced.
2022 stands out. That was a genuine bear market, people were getting more and more bearish into the fall. But I was telling everyone to go long, because that’s usually when it flips. And it did.
So to be clear – this doesn’t even require a bull market to work. In 2022 it wasn’t a bull market. It was a bear market, and the pattern still played out.
That’s the thing that catches people off guard. They start the year bullish, watch it chop and whipsaw for months, and by October, they’ve thrown in the towel – right before it turns. That’s what I’m expecting.
I’m not saying it’s guaranteed. I’m saying that statistically, it usually happens.
Michael: That word – “statistically” – matters a lot here, because seasonality has plenty of skeptics.
The idea of buying the same stock in the same calendar window just because it’s risen there for years sounds almost too good to be true.
You said yourself that often there’s no clean reason it works. So in your view, what’s actually driving these patterns underneath the surface?
William: The honest answer is: I don’t always know why. But let me show you what I mean, because this year gave us a perfect example.
Take oil. It had a big run-up early in the year, everyone got bullish, and then it dropped.
The popular explanation tied it to the geopolitical flare-ups – the Venezuela news, then the Iran situation.
But we already knew the drop was coming. We’d called the run-up before the crowd, and we’d called the top before the crowd.
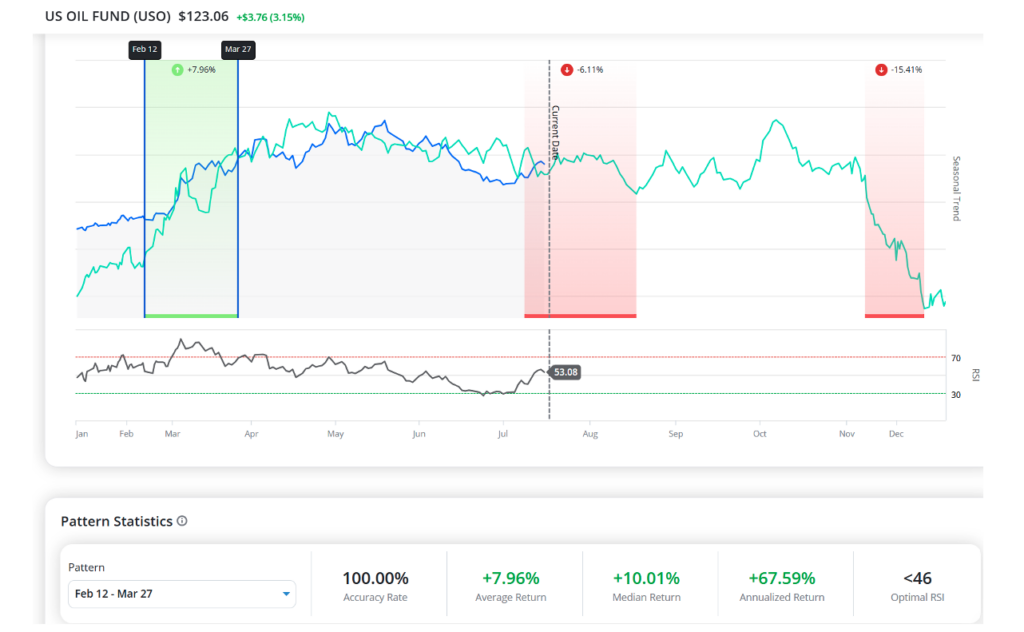
Here’s the U.S. oil fund. Over the last five election cycles, from roughly Feb. 12 to March 27, oil has risen 100% of the time in that window, for an average gain of about 8%.
And going back further, from the first trading day of the year into late April, midterm election years have been strongly bullish for oil. So even if you knew nothing about the geopolitics, simply buying oil in January and holding into late April would have been a straightforward seasonal trade.
Then it flips. Starting around April 29, in midterm years, oil has fallen 100% of the time into year-end – for an average drop of about 23%.

Here’s where it gets fun. Back in January, in Trade Cycles, I wrote plainly that April 29 was the peak of the oil run.
And on April 29, The Economist ran a piece essentially saying that anyone expecting oil to fall was “in la la land.”
Then, on July 2, they published a follow-up: “We were wrong about oil.”
I’m not a Yale geopolitical analyst. All I was doing was looking at the calendar and thinking, this has happened before, 100% of the time, so maybe it happens again. That’s it.
Michael: So with oil, you had two of the biggest catalysts of the year land just two months apart. And you could have essentially ignored both, gotten long in January, checked back at the end of April, and taken your profit.
William: You could have lived under a rock. I joke that you could put me in a windowless room with no outside information – and as long as I had the seasonal data and a chart, I could trade profitably. I don’t need to know what’s going on.
And it wasn’t just oil. We called the top in silver about two weeks before it dropped, again working purely off midterm seasonality.
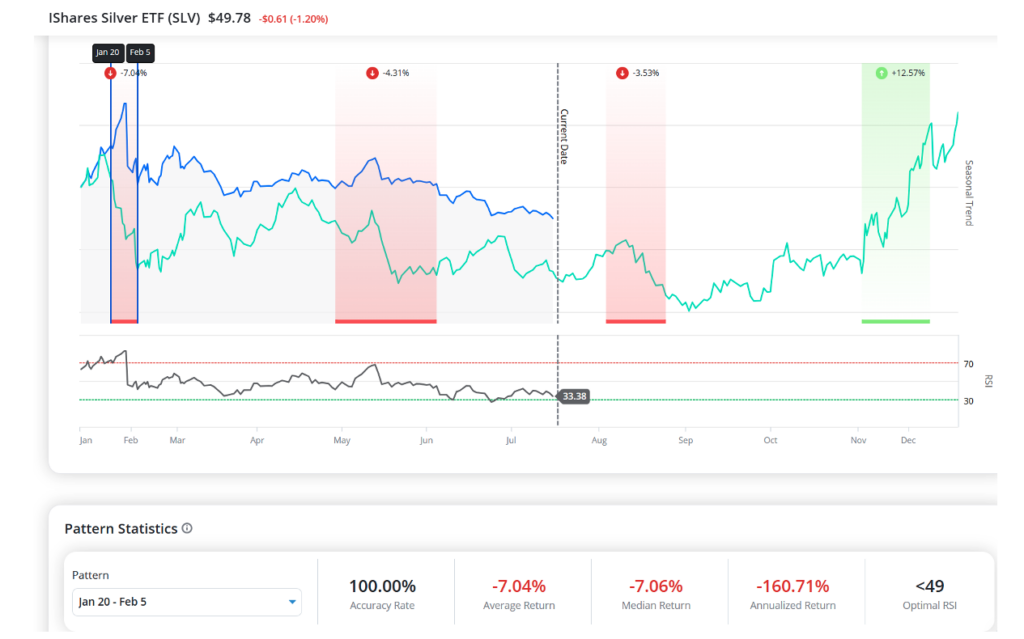
Here’s SLV. From Jan. 20 to Feb. 5, silver has dropped 100% of the time in midterm election years, for an average decline of about 7%. We were a touch early – it ran up first – but then came one of the sharper drops you’ll see, and our readers were positioned for it.
Michael: Those are great examples of how well seasonality worked in the first half. So let’s turn to what’s ahead. We’re in mid-July now. Looking out over the next three months, until things settle in October – is there anything specific on your radar?
William: Every Wednesday, I scan the market look at what’s setting up for the week ahead – and then I share those thoughts with my subscribers.
Something I’ve been looking at recently is Valero Energy.

Over the last 15 years, from about July 16 into Aug. 3, Valero has risen roughly 87% of the time for an average return of about 4%. On its own, that’s a good-looking setup – clean momentum, trading above its moving averages, healthy on our short-term indicators. That’s one worth watching.
Michael: That actually connects to something we’ve been working on here at TradeSmith.
I talked with Mike Carr, our chief quantitative strategist, last week.
He’s been finding that pairing seasonality with a “red” short-term health reading – catching stocks while they’re more oversold – tends to produce a stronger result, because the seasonal tailwind amplifies the recovery.
Have you seen that in your own work?
William: It’s funny you bring that up, because I stumbled onto the same thing independently, just a couple weeks before Mike came out with his data.
He’s been revamping our Seasonal Edge portfolio around exactly that idea – a red short-term health zone, plus an RSI gate, where the RSI has to be below a certain level and the stock has to be in that red zone to qualify.
What I’d been doing on my own time was trying to optimize for shorts. I knew we had bearish periods coming, so I was running backtests to find reliable combinations to go short with confidence.
And I couldn’t find anything. No real edge – just breakeven.
So I went down a rabbit hole and thought, well, maybe shorts only work when the whole market is bearish. I pulled the definitively bearish regimes – 2018, 2022 – and tried to build short setups there, too. Still nothing.
But here’s what jumped out: The seasonal green zones worked best in those bear markets. The highest gains, the fastest turnarounds, came from buying seasonally bullish stocks while the broad market was falling.
Seasonality worked well across almost every regime – but its weakest moments for bullish trades were when the market was ultra-extended and running up nonstop.
That’s when buyers get exhausted, and there’s not much strength left. So it tends to work best in bearish-to-moderately-bullish conditions.
Then Mike walks in with his own version of the finding, and I’m thinking, that’s exactly what I just saw.
Michael: So that’s a well-timed convergence, given how volatile things have been lately.
William: It is. And there are about 10 trades coming up in August under this new approach – combining the RSI gate and the red short-term health zone with a bullish seasonal window.
They start rolling out next week.
And the model portfolio built on this system turned every $10,000 into $85,700 in backtesting — beating the S&P 500 by an average of 99%.
That’s the kind of thing that matters most in a choppy market – a handful of high-quality opportunities hidden inside the volatility, when trading is otherwise hard.
Michael: William, thank you – it’s always a pleasure getting your read on the markets, especially across this time-zone gap.
William: Anytime.
If William’s charts today left you wanting the bigger picture, that’s exactly what Breakthrough 2026 was built to deliver.
Keith Kaplan lays out the full case for why next Thursday, July 23, sets up one of the more important seasonal shifts in years — and how tools like Trade Cycles and Seasonal Edge work together heading into the October turn William described above.
You’ll also get a closer look at the mechanics behind the strategy Mike Carr and William arrived at independently — the same one behind the 10 trades rolling out this August.
The replay comes down next week. If you haven’t watched it yet, now is the time.
Click here for the full story.
To building wealth beyond measure,

Michael Salvatore
Editor, TradeSmith Daily