This TradeSmith Tool Turns Main Street Buzz Into Buying Opportunities – Before Wall Street Catches On
Listen to the audio version of this article (generated by AI).
Michael’s Note: Today, I’m handing the mic to my colleague Mike Burnick, a senior analyst here at TradeSmith. Mike is a big-picture guy. He keeps a close eye on the confidence surveys, retail sales reports, and spending trends that tell us where the economy is headed.
Right now, those numbers are telling two different stories. Consumers say they’re worried, but they’re still spending. Mike’s job is figuring out where that money is going.
That’s what makes his take on our Social Heat Score worth your time. Mike didn’t build it. That credit goes to Andy and Landon Swan of MegaTrends. But Mike’s coming at it as someone who reads the economy from the top down, and he sees the tool as the missing link between those headline numbers and the individual stocks they’ll eventually move.
Below, he walks through how it works using a well-known toymaker as an example, and he introduces a brand-new feature that makes it easier than ever to spot the gap between Main Street and Wall Street. Here’s Mike…
It always pays to know where Americans are spending their money – after all, domestic consumer spending accounts for roughly 70% of the U.S. economy.
But stubbornly high inflation and rising interest rates are conspiring to leave consumers spent.
Last month, the U.S. Consumer Confidence Index tumbled to the lowest level seen this year, and thanks to sharply rising cost-of-living expenses, expectations for consumer confidence are looking pretty dismal over the next six months.
Yet according to retail sales data, consumers are still spending at a healthy clip… which tells me that American consumers are being more selective than ever about the products and services they’re willing to open their wallets for.
Figuring out what these consumers are embracing – or rejecting – could pay off big time if you can capitalize on the data early enough. TradeSmith’s exclusive Social Heat Score helps you do just that by tracking changes in consumer demand before Wall Street catches on.
These cutting-edge analytics were developed by TradeSmith senior analysts Andy and Landon Swan – the two brilliant brothers behind MegaTrends.
By closely examining consumer preference data – tracking millions of consumer signals across the internet to identify the products and services that people recommend online and actually buy – the Swans have gained a valuable edge in predicting which stocks are likely to outperform.
And the best part is, the Social Heat Score is built to identify lasting shifts in consumer demand – helping investors find promising stocks before Wall Street recognizes their potential.
We recently launched a major upgrade to the Social Heat Score that makes those opportunities even easier to spot.
Now, you can compare what Main Street consumers are doing with what Wall Street investors expect – and quickly find stocks where the two are furthest apart.
Grading Main Street Buzz with TradeSmith’s Social Heat Scores
The Social Heat Score combines real-time consumer engagement stats with market data, enabling it to consistently spot and grade shifts in consumer demand. And increased consumer sentiment can soon show up in a company’s bottom line – potentially boosting its stock price.
Subscribers to TradeSmith Platinum and MegaTrends can easily view Social Heat Scores for more than 1,000 stocks on TradeSmith Finance, with new tickers added to the system all the time. Subscribers can log in to their TradeSmith Finance dashboards and scroll down the home page to find the Social Heat Score, as shown below:
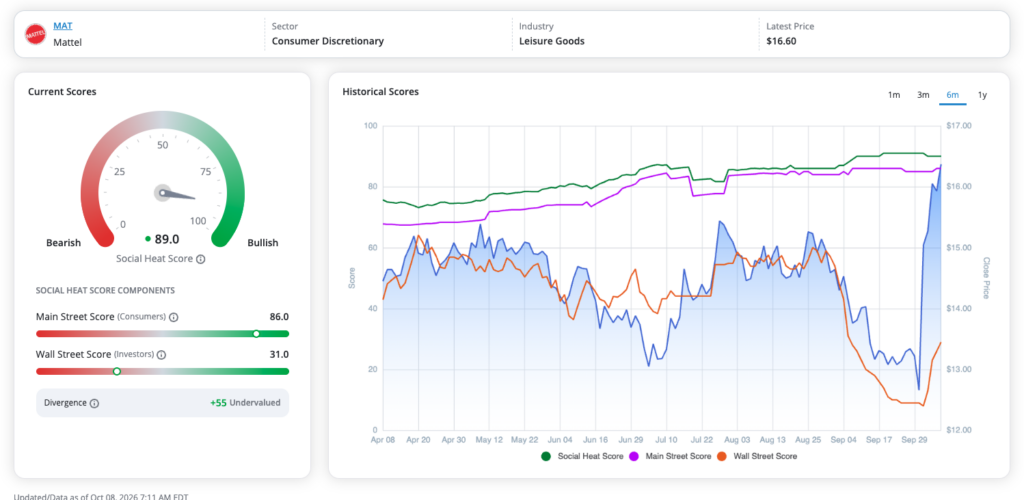
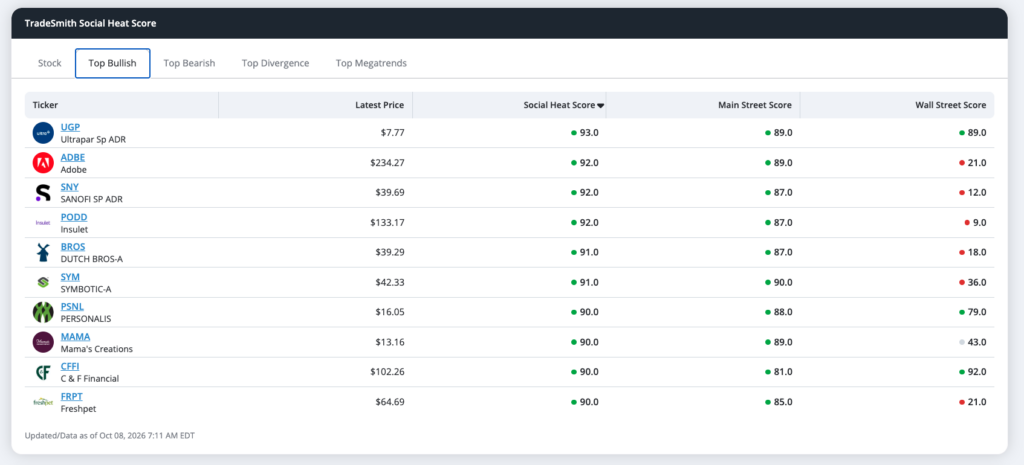
From here, you can search for stocks by ticker symbol, or you can view the current Top Bullish and Bearish Social Heat Scores by selecting the different tabs at the top of the window.
To calculate their Social Heat Score, the Swans tap into real-time social media and search data across the internet, from platforms like Google, X (formerly Twitter), Facebook, Instagram, Reddit, and more.
From there, their system tracks how consumers “vote with their wallets.”
Advanced technology processes every online post to measure consumer engagement and excitement and maps them to the companies behind the products and services consumers use. The system then identifies which signals have historically been the best indicators of demand for each company, helping us spot shifts in consumer behavior before Wall Street catches on.
They evaluate four key types of online consumer engagement data:
- Brand Mentions (Buzz): Discussion of any brand, product, or service linked to a specific company…
- Positive Sentiment: Online posts that show satisfaction or enthusiasm…
- Negative Sentiment: Negative posts that show criticism of products and services…
- Purchase Intent: Posts where people say they’ve bought or plan to buy a product/service.
It’s all boiled down into a single, easy-to-read number ranging from 0 to 100 that reflects how a brand, product, or service is resonating with Main Street consumers.
It’s simple: Social Heat Scores above 60 are bullish, and below 30 are considered bearish. The score is designed to track sustained shifts in consumer demand, making it especially useful for finding stocks with long-term upside potential.
When Social Heat Scores rise and consumers buzz about a company’s products, it can lead to a bullish reaction – and when scores drop substantially, it can signal bearishness ahead.
Diving Into Social Heat Scores and Social Heat Divergences
Let’s take a closer look at the Social Heat Score for Mattel (MAT), so you can see how easy it is to evaluate a stock.
Mattel is a brand that produces a wide range of toys and games for children of all ages: Just think of icons like Barbie, Hot Wheels, Uno, and Polly Pocket.
By searching for MAT in the Social Heat Score window, you can easily track the company’s stock price trends over time along with changes in the Social Heat Score. At time of writing, MAT holds a very high Social Heat Score of 89 out of 100:
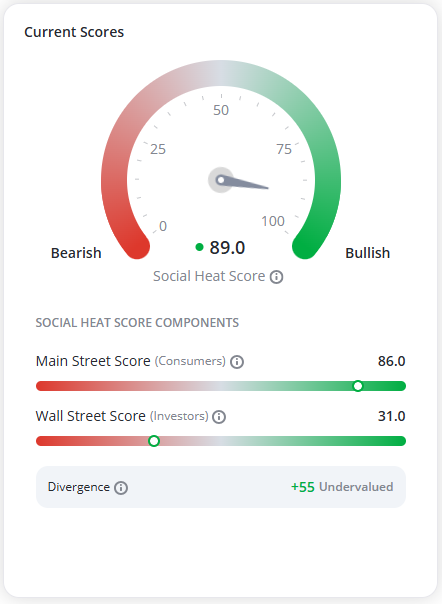
That’s a strong bullish read… especially considering MAT shares are down 11% this year.
This tells me its high Social Heat Score could very well be the catalyst for a significant rebound rally in the share price.
Take a closer look at the gauges on the left, and you’ll notice that MAT has a very high Main Street Score, based on consumer sentiment. But the Wall Street Score, reflecting investor sentiment, is in the dumps like the stock price – with a score of just 31.
And that’s the key to uncovering potentially winning stocks before they make a big move: Find stocks with rising Main Street Scores from consumers, paired with low expectations on Wall Street… and you’re on your way to a hot opportunity.
Alongside the Social Heat Score, you can focus on how the Main Street Score and Wall Street Score have changed over time, as graphed below:
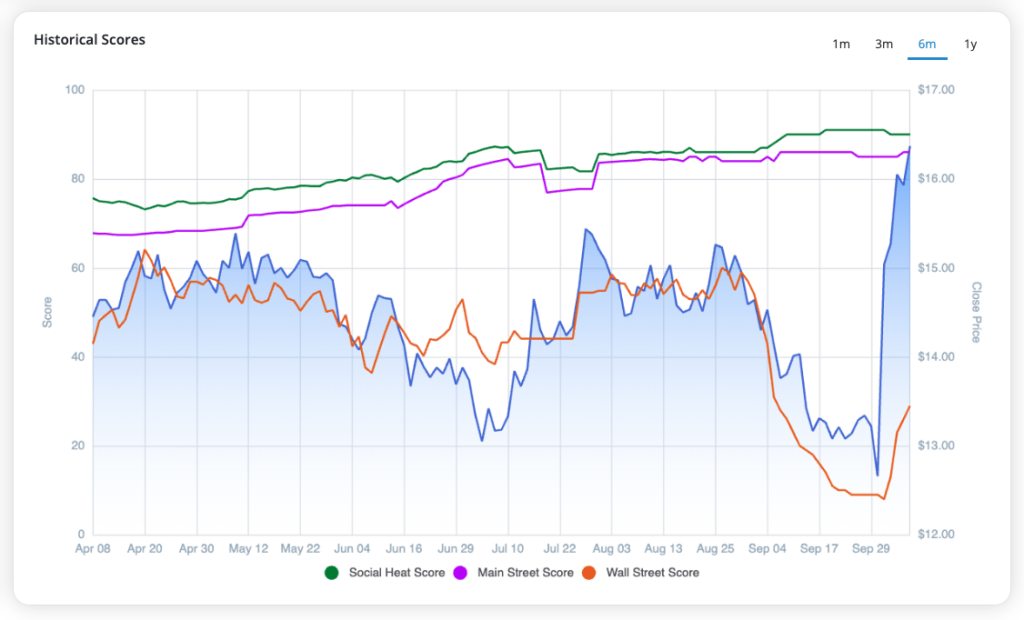
The Main Street Score measures what we care about most – how a company’s products and services are performing with consumers. Higher is better – and at 86, MAT ranks near the top.
The Wall Street Score, on the other hand, reflects what investors currently expect from the company. For MAT stock, Wall Street has low expectations – which means a low bar for the company to clear.
You should pay especially close attention to companies with a strong Main Street Score coupled with a low Wall Street Score. The wider this divergence, the more upside potential.
When consumer sentiment is on the rise, it means business prospects may be improving, well before Wall Street analysts or investors catch on.
That’s often the best trade setup of all.
Spotting these divergences early is how the Swans found Robinhood Markets (HOOD) before a meteoric 556% price gain… and how the pair entered Oklo (OKLO) before it soared 461%.
The all-new Top Divergence list in their Social Heat Score tool makes it easy for you to spot these disconnects in seconds, and jump on potentially winning trade setups with just a few clicks:
Just click on the Top Divergence tab, and you’ll quickly find stocks where Main Street sentiment is more bullish than Wall Street’s opinion implies. And that’s where you’ll find hidden rebound opportunities.
The Divergence scores on this list measure the distance between what consumer data indicates and what investors are pricing on Wall Street. The math behind divergence itself is simple:
Divergence = Main Street Score – Wall Street Score
So when Main Street is stronger than Wall Street, the Divergence Score is positive. The wider the positive spread, the more consumer strength runs ahead of investor expectations.
The sweet spot is on the positive side of the scale, stocks that read Undervalued or, even better, Deep Value. These are the stocks where consumer demand is running well ahead of Wall Street expectations.
- +60 to +100 = Deep Value
- +10 to +59 = Undervalued
- -20 to +9 = Fair Value
- -60 to –21 = Overvalued
- -100 to –61 = Deeply Overvalued
The new Top Divergence tab lets you scan these differences across the market at a glance – making it easy to zero in on mispriced, undervalued stocks.
Mike Burnick’s Bottom Line: The Swans’ Social Heat Scores can give you an edge in predicting the market’s next winners. They harness the power of consumer buzz to provide you with unique insights on stocks with popular products and services. And when Main Street enthusiasm diverges from Wall Street expectations, you have an edge at uncovering new opportunities ahead of the crowd.
Good investing,

Mike Burnick
Senior Analyst, TradeSmith