This X-Ray View Shows When Stocks Tend to Rise and Fall
Listen to the audio version of this article (generated by AI).
How often do you see a photo that makes you question everything you thought you knew?
That’s how Nobel Prize-winning biologist James Watson described seeing “Photograph 51” for the first time, in January 1953.
It was a strange, blurry image taken by British chemist Rosalind Franklin with a technique called X-ray crystallography.
It captured a crucial pattern in our DNA that no one had detected before. The DNA strands twisted and crossed into what we now know as the double helix.

Watson didn’t discover DNA — that happened back in 1869. But 80 years went by before Franklin’s X-ray image revealed the hidden pattern that had been there all along.
Something similar is true of the stock market. On the surface it can seem random, but there are also hidden patterns of how stocks move. You just have to have the right technology to spot them.
And like the DNA double helix, you can’t do it with the naked eye. You need an X-ray view.
That’s what TradeSmith’s Seasonality software is designed to do. We ran thousands of stocks through the same test, going back 33 years of market history. And we found reliable windows when they tended to rise and fall.
These patterns have held up through bull and bear markets, manias and panics, wars, and pandemics.
Based on these signals, we created a rapid-fire trading strategy to pinpoint bullish seasonality windows on 5,000 stocks – to the day. In our backtests, the system got the direction right 83% of the time — meaning the stock finished the window higher, not lower.
The returns beat the broad market, too. In an 18-year backtest, a model portfolio of these seasonal trades returned 857%, versus 412% for the S&P 500.
That doesn’t mean the system will deliver those exact returns when you run it live. But it’s an edge worth paying attention to.
On Thursday, more than 16,000 viewers joined me for my Breakthrough 2026 event to see how this X-ray view works.
I walked them through how one of the most important bullish windows in the entire market closes next week — and how it closes right as the market’s biggest names report earnings. It’s the kind of moment where your timing matters more than stock picking.
Watch it here while it’s still online. Then read on for more on how this system works — and three seasonal setups for your radar right now.
Buy on These “Green Days”
Finding seasonal cycles in stocks on your own would be an enormous undertaking.
You’d have to pull up a one-year chart like this one for Google parent Alphabet (GOOGL):
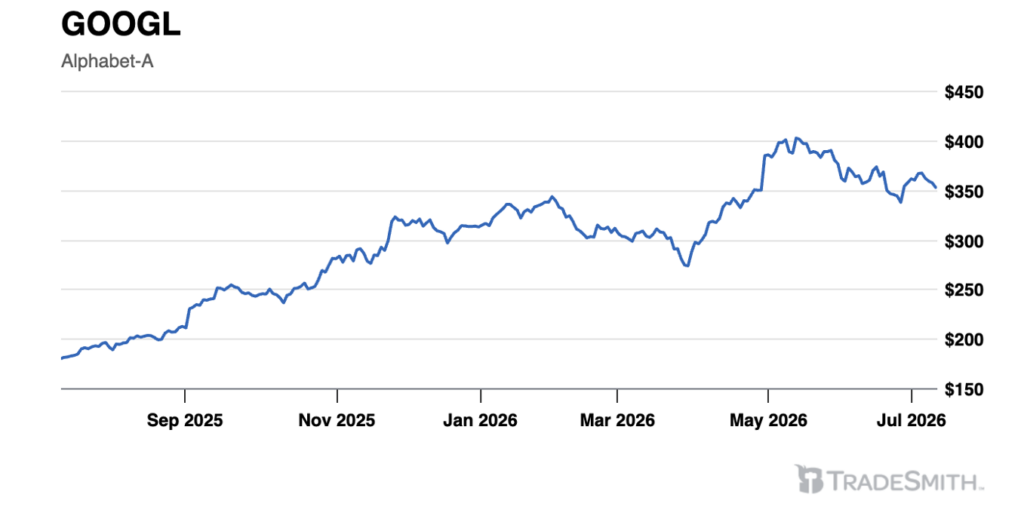
Then line up one-year charts like this, one after the other, going back a decade or more…
…and keep track of how that stock behaved across thousands of trading windows.
Or you could just type GOOGL into TradeSmith’s Seasonality software. It averages as many years as you want and gives you one simple seasonality trend line.
Best of all, it highlights “green days” when the stock has gone up 80% of the time or more. Plus “red days,” when it’s fallen more than 80% of the time.
You can do this for pretty much any stock you want and map out high-probability trade setups in advance. Not just the buy date, either – but the sell date, too.
In the past 15 years, GOOGL has had stretches of green days in January, May, July, and late October. But the best window is the one we’re in now:
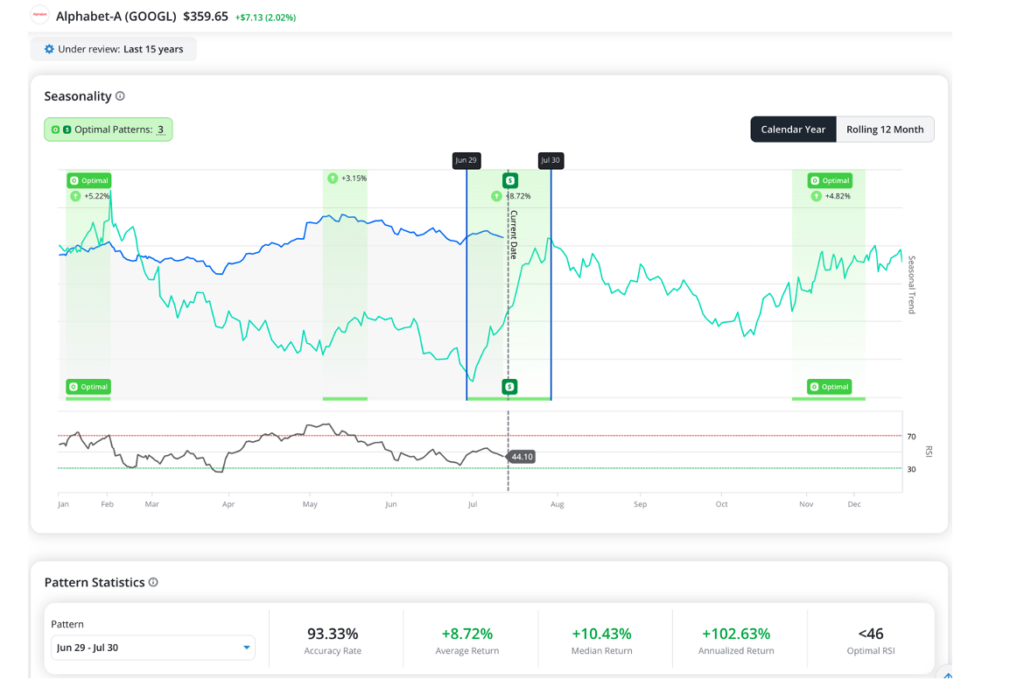
Between June 29 and July 30, Google stock has gone up in 14 of the past 15 years with an average return of 8.7%. In 2025, the price action lined up almost perfectly, with GOOGL gaining 8.9% during that seasonally bullish window.
More Bullish Trades for Your Radar
Take Deckers Outdoor (DECK), the maker of Ugg boots and Hoka running shoes. DECK’s next green zone is July 29 through Aug. 14. In that window, the average return was 3.5% over the past 15 years:
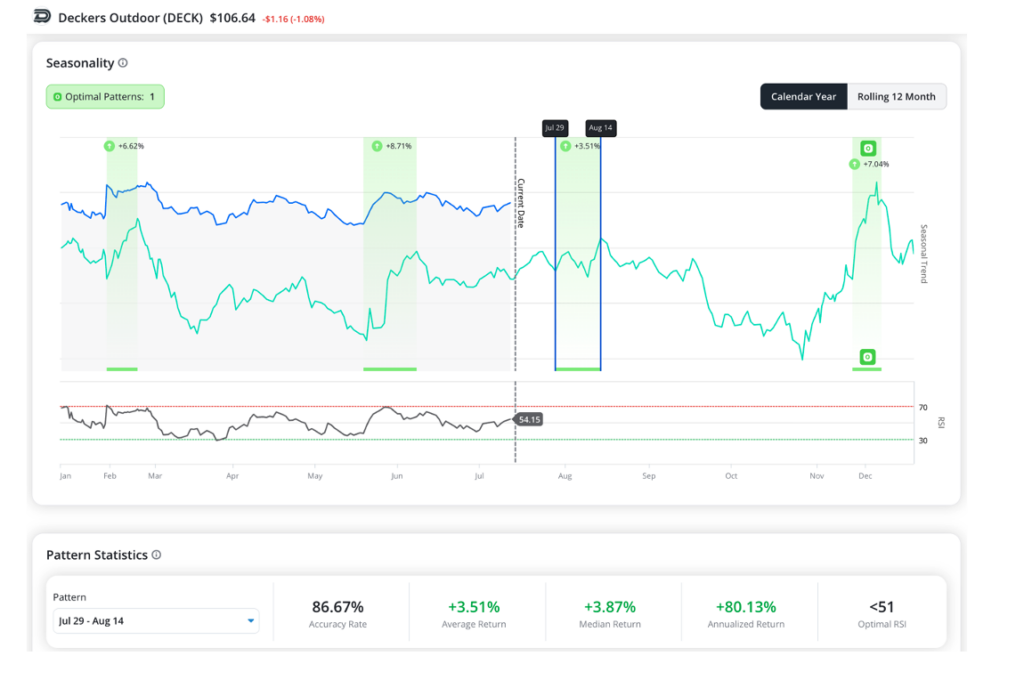
Then DECK has an especially strong bullish window starting Nov. 23. Buying that day returned an average 7% through Dec. 11.
Those are the optimal patterns to follow our seasonality strategy, trading individual stocks at their absolute best times of year.
Or take Applied Materials (AMAT), which builds machines that are used to make advanced computer chips.
It gained 10% during its first stretch of green days on our seasonality chart in January and February.
And in a seasonally bullish window in May, AMAT climbed 16.8%.
But don’t be surprised if that party ends by August. From July 30 to Aug. 31, AMAT has fallen 80% of the time, with an average loss of 2.9%:

I’m sure you’ve noticed all the other times of year that don’t get these green or red windows. They’re times when there isn’t a statistically strong enough pattern to rely on. When the data doesn’t clear our bar, we leave it alone. No signal, no trade.
Using TradeSmith’s Seasonality tool, we’ve put this approach to the test across thousands of stocks, indexes, and even commodities and currencies.
And, as I mentioned up top, over an 18-year backtest following these seasonal trades delivered 857% in total returns – more than twice what the S&P 500 delivered over the same stretch.
The worst year in our test was 2007 – and even then, our strategy still turned a profit. It beat the S&P 500 by more than two to one that year.
Mark Your Calendar for These Key Dates
I dove into the details during my Breakthrough 2026 event.
I walked through the seasonal patterns coming up that you need to watch for… why they keep working even when markets get chaotic… and how to put them to work in your portfolio.
As you’ll see, getting your seasonal timing right could matter more to your wealth than any stock pick you make this year.
The next date to watch is July 23. That’s when one of the biggest green zones in the entire S&P 500 comes to an end.
Every prior year it’s closed, the market has turned choppy — and this time it closes right as Tesla, Amazon, Apple, and Microsoft report earnings. I don’t know which way the biggest names will break.
But I’d rather watch that window close with my eyes open than be blindsided by the market regime shift it could trigger.
All the best,

Keith Kaplan
CEO, TradeSmith