War or Not, We’re Bearish on Oil
Listen to the audio version of this article (generated by AI).
In This Digest:
- We’re bearish on oil, despite the worsening war in Iran
- Why our top consumer experts are watching airliner earnings this week
- This AI software stock is “down a lot, up a little” – and that’s bullish
The war in the Gulf is heating up again, and Americans are not happy about it…
The U.S. has resumed its blockade of the Strait of Hormuz. And it’s been pounding targets across Iran.
In response, Iran has fired missiles and drones at energy plants, water plants, and other targets in Bahrain, Kuwait, and Jordan.
And Iran-backed Houthi militants have threatened to blockade the Red Sea. This would close off the backup oil export terminal that Saudi Arabia began using at the start of the war… and further push up oil prices.
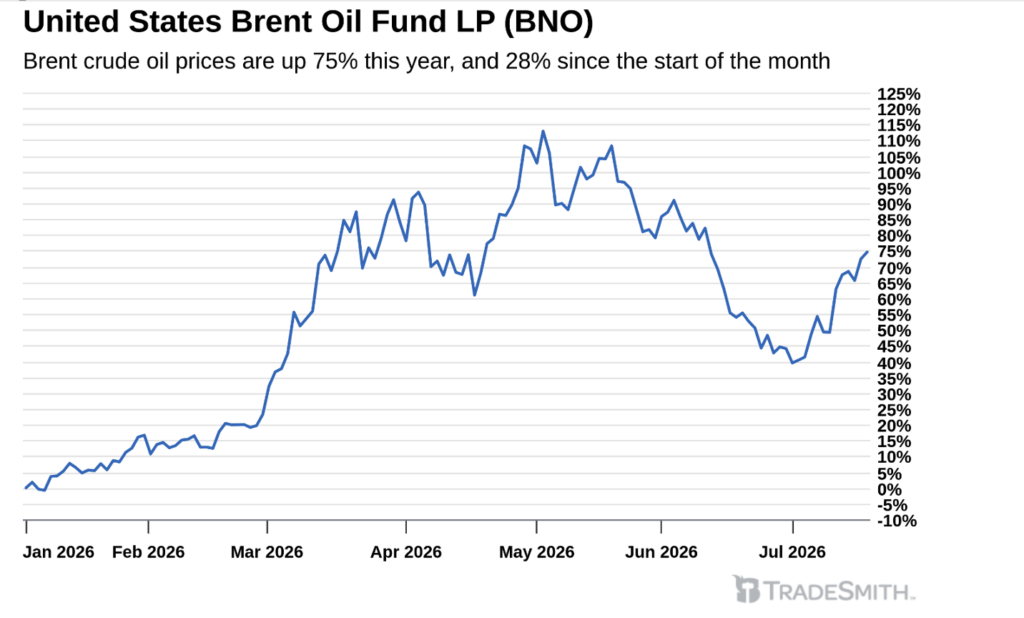
International oil prices – as measured by the United States Brent Oil Fund LP (BNO) – are already up 75% this year. And they’re up 28% in July alone:
Meantime, U.S. gasoline costs are cresting $4 a gallon once again, right in time for the busy summer travel season.
Things have gotten to the point that even President Trump’s most die-hard supporters now agree with the majority of Americans who say the war isn’t worth the economic costs.
Back in May, half of Trump’s base thought the war with Iran was worth the economic pain, according to a new Politico poll. Now, just over a third do.
But our Seasonal data shows oil prices have a downward bias for the rest of the year…
Here’s a seasonality chart of the United States Oil Fund (USO) in midterm years going back five election cycles:
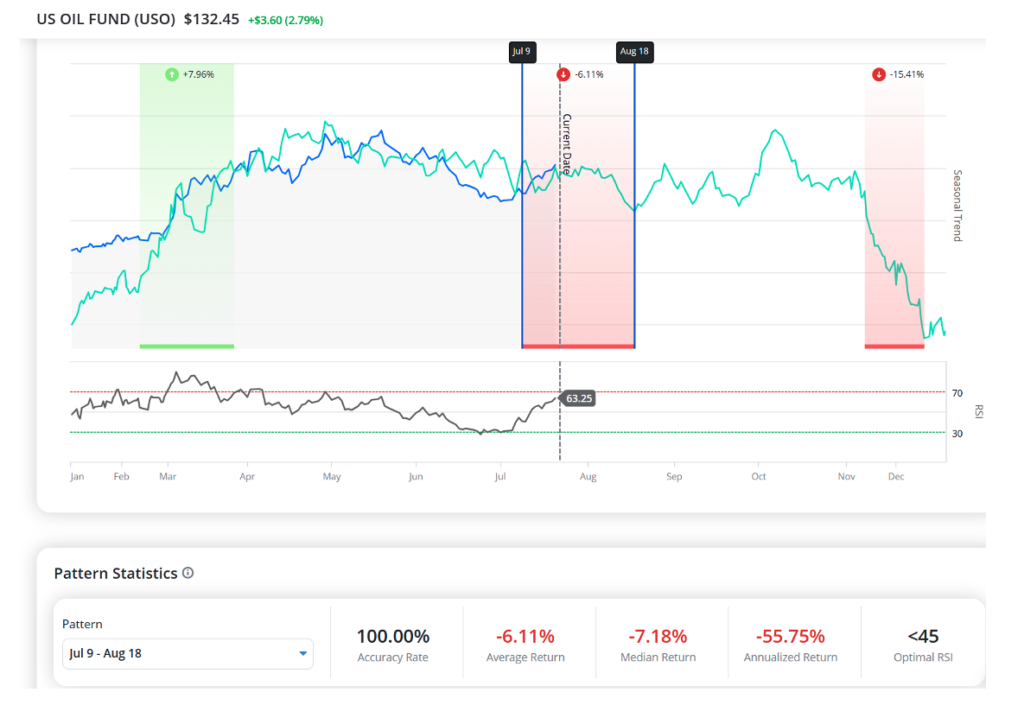
As you can see, between July 9 and Aug. 18, USO has seen an average loss of 5.5% in midterm years. So there’s seasonal pressure working against the current rise in oil prices… which suggests now’s not the time to buy oil stocks.
There’s an even steeper historical decline in oil towards the end of the year. In each of the five historical midterm election years, oil has fallen an average of 15.4% from Nov. 12 – right after elections – through Dec. 18.
And as you can see, seasonality has been spot on with oil so far this year. Just look at the blue line (oil’s price throughout 2026) with the green line (the average of how oil has moved in each of the past five midterm election years). All year long, they’ve stuck close together.
That’s the benefit of trading with our Seasonality software.
Last week in our Breakthrough 2026 event, TradeSmith CEO Keith Kaplan walked through seasonal patterns just like these, why they’ve held up across market cycles going back decades, and how to check any stock in your portfolio for its own seasonal tendencies.
It’s not about predicting the news — it’s about knowing what a stock has actually done on this stretch of the calendar, year after year.
Once the replay is offline, this window closes with it.
So if you haven’t watched Breakthrough 2026 yet, don’t wait. Today is the last day to gain access before it goes offline, so click here to watch now.
These two airlines’ stock earnings reports are a must-watch…
Earnings season is in full swing, with Alphabet (GOOGL) reporting after today’s close. Tesla (TSLA), Meta (META), Microsoft (MSFT), and Amazon (AMZN) aren’t far behind.
But our consumer sentiment experts, Andy and Landon Swan, think the best trade to make isn’t necessarily in tech… but a class of stock few investors are talking about right now.
That’s because, instead of scanning price charts or mainstream media headlines, their Social Heat Score tracks real-time consumer behavior to rate stocks.
Web traffic, app downloads, social buzz – understanding all of it can tell you how consumers think and talk about brands. And Andy and Landon Swan have distilled it into a simple 0-100 score. The higher the score, the hotter the stock.
And that Main Street edge goes well past Wall Street expectations.
When that gap shows up right before a company reports earnings – a notoriously volatile event – you have a great short-term trade setup.
The Swans are focused on airline stocks in this week’s Earnings Season Pass – our earnings-based trading advisory.
Two names in particular are lighting up.
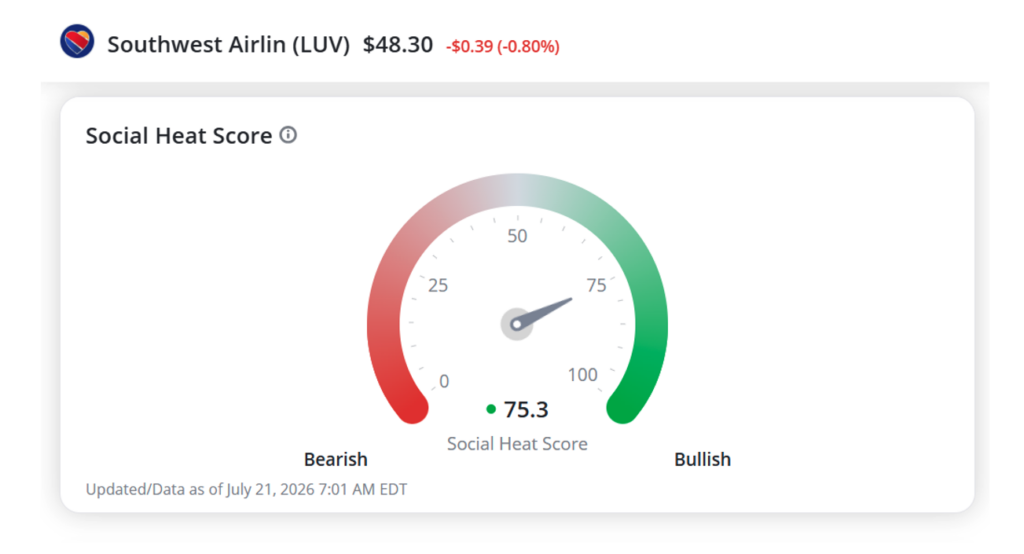
Southwest Airlines (LUV) carries a Social Heat Score of 75.3, squarely in bullish territory, as consumer chatter around the airline runs hot ahead of today’s earnings report.
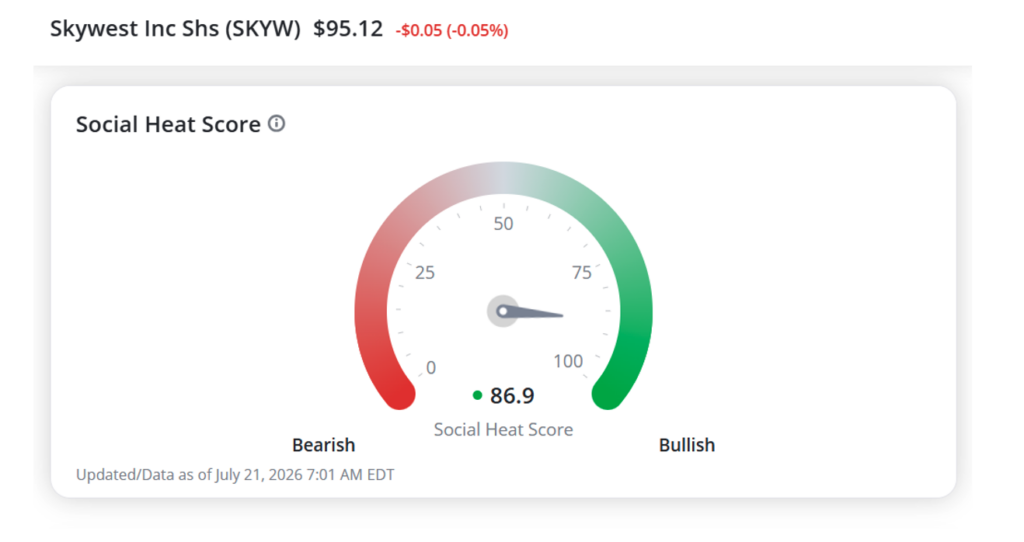
SkyWest (SKYW) is running even hotter, at 86.9, with its report due tomorrow.
Southwest and SkyWest stood out on this week’s Scorecard for strong historical performance ratings and consumer-demand signals that back up the bullish setups. And on Monday, they recommended a trade on LUV to their subscribers.
Andy and Landon used that same process to flag a Netflix (NFLX) divergence to kick off last summer’s earnings season before a 100% gain on a bearish options trade.
If you’re a paid-up subscriber, make sure you’re in position before today’s report after market close. And if not, keep an eye on the stocks to see how they swing this week.
One buy-the-dip idea before you go…
Recently, I started to track an internal screen we call “Down a Lot, Up a Little”.
It looks for quality stocks – based on our Quantum Score – that have fallen significantly from their one-year high and are also trading at their highest price in the past 10 days.
Regular readers know the Quantum Score is our measure of stocks’ fundamental strength (based on earnings, revenue, and profit margin growth rates) and technical health (price momentum and unusually large inflows from large Wall Street institutions).
One stock that stood out to me this week is customer management software maker Sprinklr (CXM). First, let’s look at the chart:
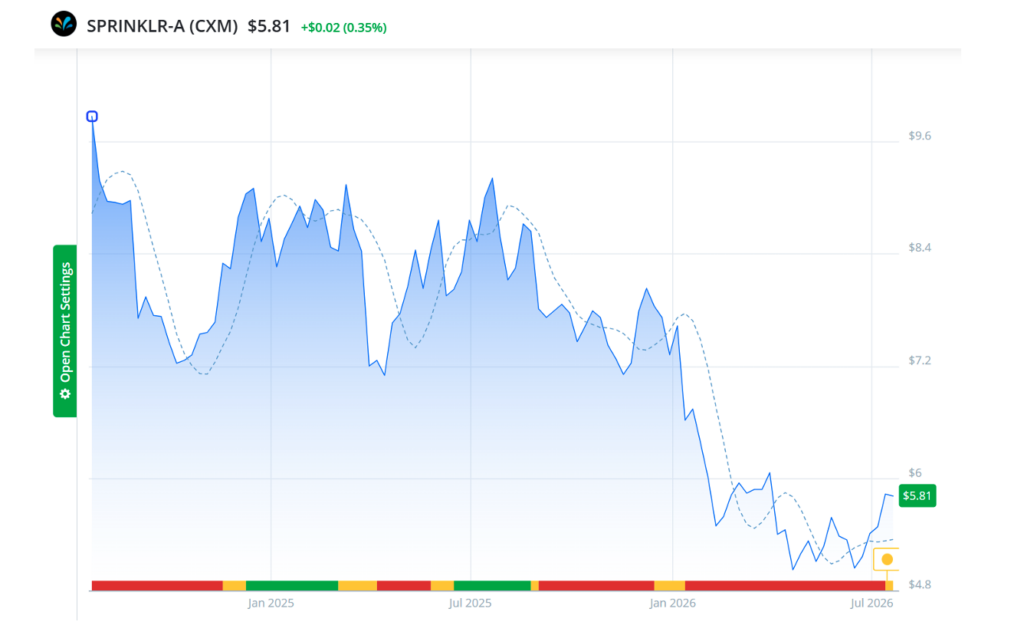
Short-Term Health – our indicator that tracks short-term trend shifts – has been Red on CXM since Sept. 1 of last year. That’s bearish. Since then, the stock has fallen as much as 35%.
But recently, the stock broke to a 3-month high and shifted from Red to Yellow – a speculative, early buy signal.
Now, pair that with its Quantum Score:
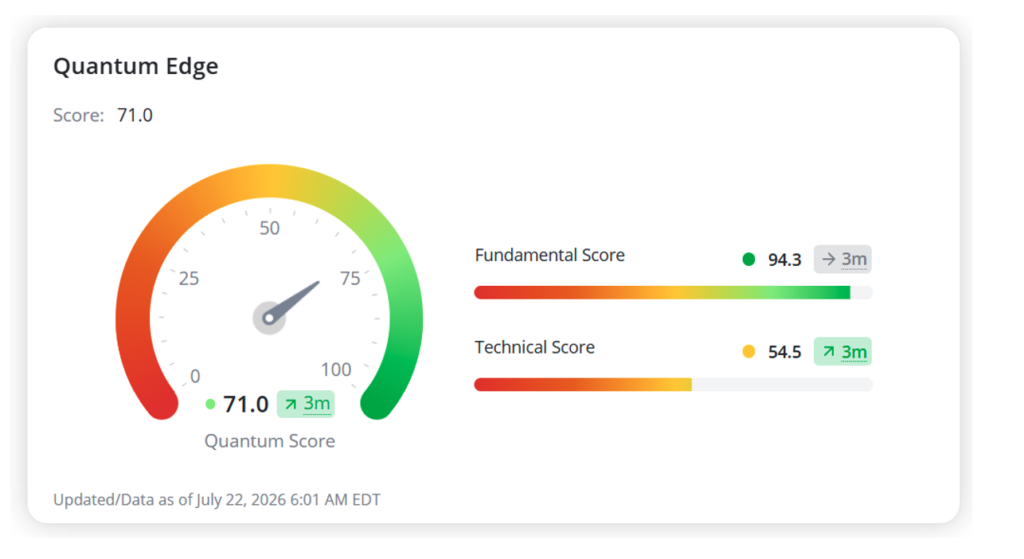
CXM has exemplary balance-sheet growth, with its Fundamental Score at 94.3. Its Technical score is low at 54.5 but has improved over the past three months. Overall, the stock gets a 71 – just barely in overall buy range.
From where we sit, CXM looks like an interesting, speculative rebound play. Keep an eye on it.
To building wealth beyond measure,

Michael Salvatore
Editor, TradeSmith Daily