Why Google’s Earnings Beat Was Actually a Historic Miss
Listen to the audio version of this article (generated by AI).
Michael’s note: Alphabet just posted its best headline earnings quarter in company history – net income nearly quadrupled, and EPS blew past estimates. Yet the stock fell nearly 8% in the days that followed.
And that’s because, if you look at one critical factor, it wasn’t a beat at all. It was actually a historic miss.
Today we’re handing over the reins to Mike Burnick, editor of Inside TradeSmith and our top options-selling expert, with the full story.
He’ll walk you through the accounting quirk that inflated Alphabet’s headline number – and the far more telling metric hiding underneath it.
Plus, he’ll show you five great cash-generating businesses you can buy instead…
BY MIKE BURNICK, SENIOR ANALYST, TRADESMITH
Second-quarter earnings reporting season is off to a great start: So far, S&P 500 companies are reporting year-over-year earnings growth of 38%. That’s excellent news already – and there are still plenty of reports to come before this earnings season ends.
But the devil is in the details… and that’s where a few earnings season shenanigans can mislead you.
For example, let’s take a look at Google’s parent company, Alphabet (GOOGL).
Last week, the company reported a net income of $112.1 billion and an earnings per share (EPS) of $9.11. That was almost four times the $28.2 billion Alphabet earned this time last year.
But $90 billion, or 75%, of that $112 billion of net income came from “paper gains.” More specifically, the reported EPS number was inflated by non-cash gains from the company’s stakes in SpaceX (SPCX) and Anthropic. When you exclude those paper profits, Alphabet posted just $14 billion of net income… or an EPS of $2.85.
That’s a far less impressive result than the headline EPS result of $9.11 would lead you to believe.
You have to dig deeper into the financial fine print to figure these things out.
But fortunately, you don’t need to be a detective to do it. With the tools we offer at TradeSmith, it takes just a few clicks.
Find the Facts with TradeSmith’s Financials
Take a look at the Financials tab for Alphabet (GOOGL) in our analytics platform TradeSmith Finance:
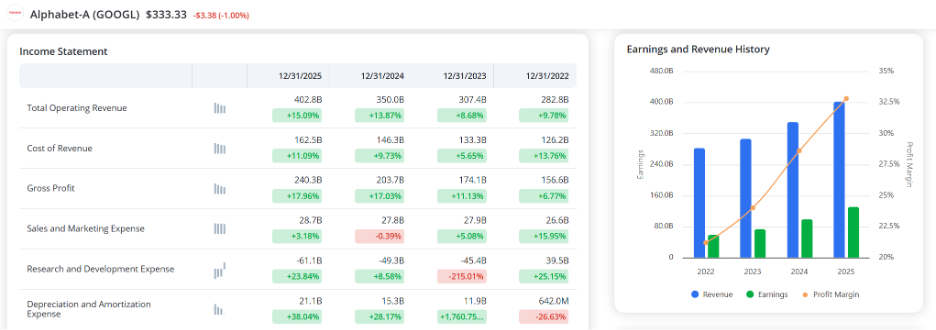
This page is a one-stop shop for financial data on each stock you research.
In addition to the Income Statement shown at the left, this tab also includes bar graphs showing more key data, including Earnings and Revenue History as well as actual versus estimated EPS metrics.
With these stats, we can uncover a worrying development in GOOGL’s balance sheet.
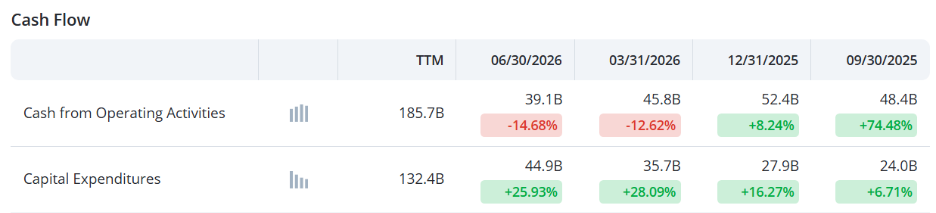
For the past few quarters, GOOGL’s Capital Expenditures have run smaller than its Cash from Operating Activities. This past quarter, however, CapEx ran higher than Cash Flow. That means GOOGL’s free cash flow came in at a negative $5.8 billion this past quarter.
That’s a first. Since Alphabet went public in 2004, the company has never once reported negative free cash flow – not during the 2008 financial crisis, not during the dot-com hangover in its early years, not even during the COVID shutdown in 2020.
And that’s a big reason why, despite great headline results, Alphabet shares tanked 7.5% last week.
GOOGL said it expects to spend $200 billion in CapEx this year alone. By comparison, the company’s total free cash flow over the last 12 months was only $53.3 billion.
No wonder investors are nervous about so much spending eating into Alphabet’s cash flow machine.
Now, I don’t mean to pick on Alphabet here. It’s a quality company with a wide moat around its business, and a well-established track record for growth. But its recent results can be a bit misleading.
And Alphabet’s not alone in this: Other leading “Magnificent 7” mega-cap stocks like Microsoft (MSFT), Nvidia (NVDA), Tesla (TSLA), and Meta Platforms (META) are reporting similar one-time “paper gains.”
That’s why, for my money, when it comes to evaluating a stock, the best metric to use is free cash flow, not earnings per share.
It’s just too easy these days for creative accountants to manipulate earnings. Which is why free cash flow – the actual cash earned by a business – is a much better and more revealing number to use.
And the best way to find potential winning stocks is by Free Cash Flow yield. That is, a company’s free cash flow divided by its enterprise value (market capitalization + debt).
Companies with high free cash flow yields deliver superior risk-adjusted returns, compared with stocks selected by the more popular Price to Earnings (P/E) ratio.
In fact, S&P 500 stocks with the highest free cash flow yields outperform stocks with low P/E ratios by more than 4% historically – and with less volatility, too.
So, let’s avoid stocks with earnings inflated by “paper gains” – and zero in on stocks with superior free cash flow yields in the process…
How to Screen for Stocks That Actually Generate Cash
Let’s screen for stocks with a few key qualities:
- We want healthy stocks according to our TradeSmith Health Indicators, by filtering for Health (Short-Term) and Health (Long-Term).
- Next, we’ll look only for stocks in the S&P 500 (SPX) to narrow our search to only those stocks in the benchmark index.
- Finally, we’ll find stocks with a Free Cash Flow Yield of more than 6%.
The average free cash flow yield for the S&P 500’s component stocks is just over 3%. So, for this screener we’re zeroing in on stocks with at least twice that average yield.
When I ran this screen yesterday, I came up with 58 results. All are healthy stocks with higher-than-average free cash flow yields. Here are the top five (and if you’re a TradeSmith subscriber, you can create this screener to find the full list):
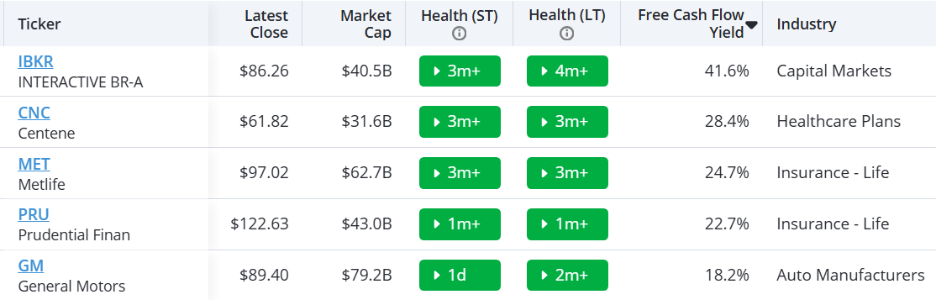
Earnings reporting season can be tricky. That’s because the reported earnings numbers that make the headlines can be less than meets the eye.
But by keeping an eye on proven outperformance qualities like free cash flow yield, you’ll have a far better time judging a stock’s true cash earnings potential.
Good investing,
Mike Burnick
Senior Analyst, TradeSmith