


Listen to the audio version of this article (generated by AI).
By 1988, I’d spent more than two decades on Wall Street.
The hottest technology in any office that year was the fax machine. Businesses still ran mostly on paper.
That year, a company called Innodata (INOD) started in New York City.
Its business was about as unglamorous as it gets. It took printed pages, such as publishers’ archives and legal documents, and turned them into digital files a computer could read. Then, it tagged and organized all that content so its customers could find what they needed.
It was useful work. But it wasn’t the kind of story that gets investors excited.
Innodata went public in 1993. And Wall Street practically forgot it existed…
For the next 30 years, its stock traded mostly flat at a single-digit price.
Then, the AI revolution arrived…
Innodata had spent decades taking messy information and organizing it so a computer can understand it. And as it turned out, this skill was exactly what AI systems need.
Today, Innodata prepares and labels the data AI systems learn from.
On January 3, 2020, two different stock-picking systems flagged Innodata as a “buy” on the same day.
One was my Power Gauge. The other was built by two brothers named Andy and Landon Swan.
Remember, this was nearly three years before AI platform ChatGPT launched.
From there, Innodata soared as high as 7,476% through earlier this year. Take a look…
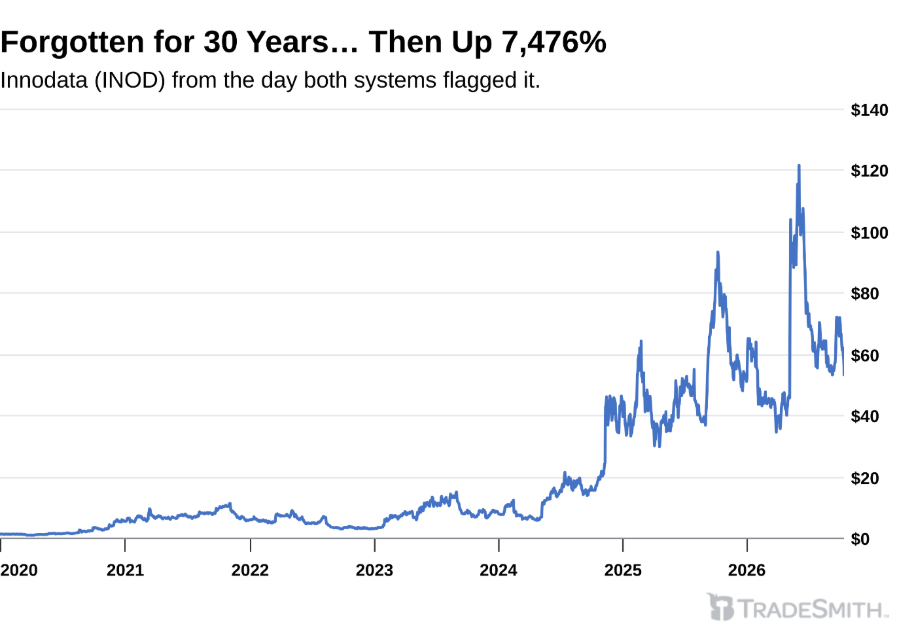
Innodata wasn’t a fluke. As I’ll show you today, when these two systems agree, they have a knack for finding huge opportunities at the exact moment everyone else is telling you to run away.
This combination has led to one of the biggest changes to my strategy in 60 years… and potentially the most profitable.
I’ll get to that in a moment, plus some of the outsized gains it flagged in testing. First, a little background…
Hedge Funds Have Paid $750,000 a Year for This Research
My Power Gauge looks at more than 20 factors behind a stock.
These factors consider a company’s finances, its earnings, and whether – on balance – big institutional money is flowing in or out. Then, the system boils all that down to a single rating. It turns green when the overall picture looks strong. And it goes red when the picture looks weak.
The Swans look at something different from my Power Gauge…
Since 2012, they’ve tracked what millions of Americans post online about what they’re buying or thinking of buying – the restaurants they visit, the products they love, and also the ones they hate.
When a product starts catching on, the Swans see it in their data long before it shows up in a company’s earnings. Some of America’s top hedge funds have paid up to $750,000 a year for access to it.
Think of it like an early warning system for where the next wave of consumer spending is headed.
The Power Gauge is the buoy near the shore. It reads how big a wave is as it gets close. And its red, yellow, and green ratings tell you whether it’s a good time to get on it.
The Swans’ online consumer sentiment data is the sensor on the ocean floor. It picks up that wave at source… the moment people start buying.
When the sensor and the buoy agree, we say the two systems are aligned. And when we went back and tested what happened after those moments, the results surprised even me.
Let me give you some more examples…
The Stocks Everyone Else Was Running From
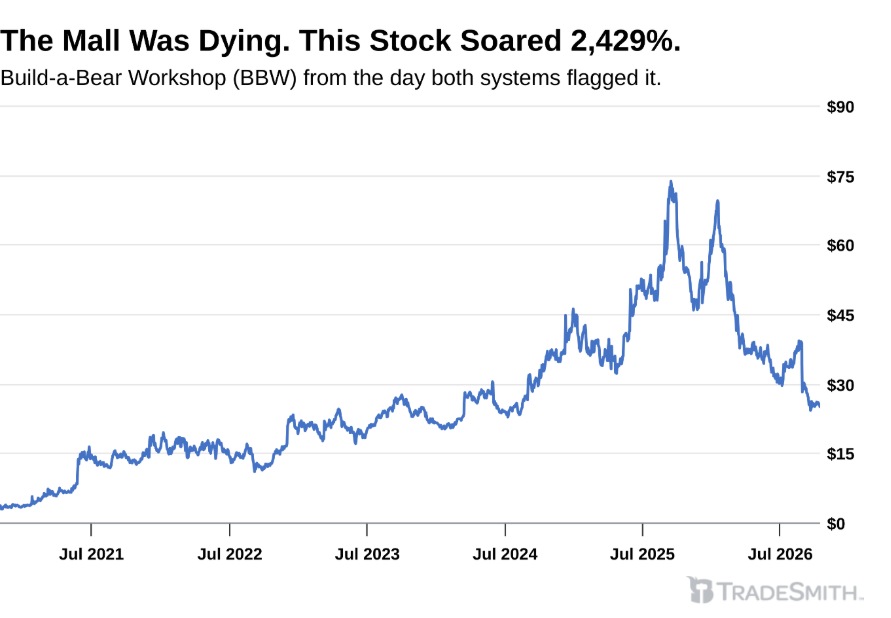
Take Build-A-Bear Workshop (BBW).
In 2020, Wall Street analysts warned investors to stay away from mall stores.
J.C. Penney, Neiman Marcus, and Lord & Taylor had all filed for bankruptcy. Coresight Research predicted 25% of malls would close within five years.
As far as Wall Street was concerned, Build-A-Bear was a children’s toy brand parked in buildings everyone expected to go dark.
But the Swans’ consumer sentiment data was picking up a shift. More of the people buying the bears were teens… and even adults. Today, about 40% of the company’s sales come from these older buyers.
In November 2020, our two systems aligned on the stock. From there, it soared as high as 2,429%.
Or take quantum computing company Rigetti Computing (RGTI).
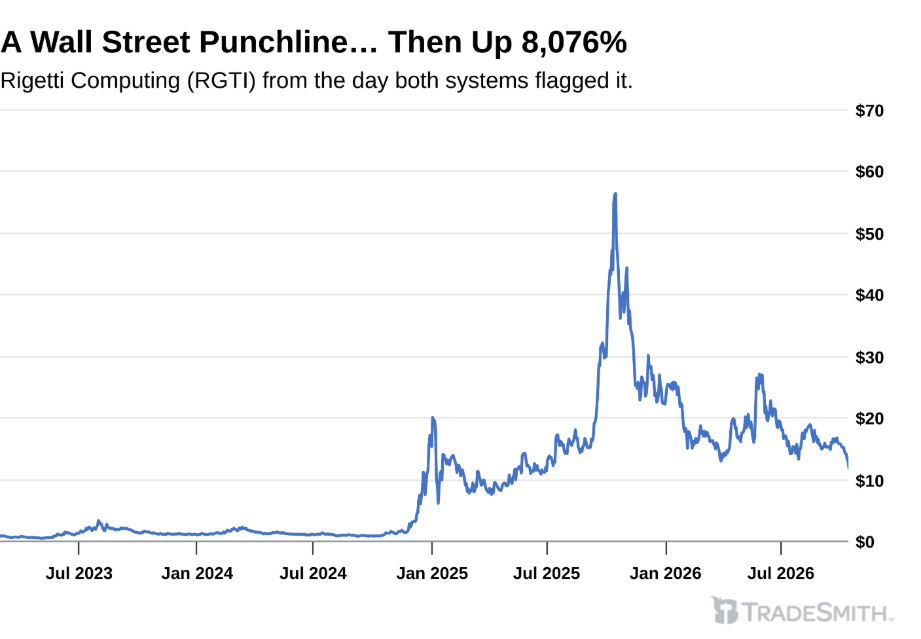
In early 2023, it was a Wall Street punchline. Its stock had fallen more than 90% since going public. It faced delisting, and its founder and CEO had stepped down. The Financial Times was writing about a “quantum computing bubble.”
On March 9, 2023, during what looked like the darkest possible moment for the company if you were following the news headlines, our systems aligned on Rigetti. Over the next two and a half years, it rose as much as 8,076%.
These aren’t the only examples. We found 432 cases where the two systems aligned. In 260 of them, or 6 out of every 10, the stock went on to double or more at its peak.
These are some of the best examples from our backtest. And of course, no system wins every time.
But I’ve been testing stock-picking systems for 60 years… and I know a breakthrough when I see one.
Which is why I’m breaking a rule I’ve followed for my entire career.
Why This Matters for You Now
For six decades, I told my readers to “ignore the noise” – the headlines, the chatter, and the opinions. But recently, the Swans showed me that some of what I thought was noise is among the most valuable data in the market… if you know how to measure it.
Innodata, Build-A-Bear, and Rigetti had one thing in common. When our systems flagged them, the crowd was either ignoring them or running the other way.
Our systems caught them at the earliest possible stage.
That’s why I’m joining Andy and Landon for our Stock Tsunami Event tomorrow, October 27, at 1 p.m. Eastern time.
And if you want to know where the next big wave of spending will hit, I urge you to join us.
We’ll show you what our two systems are flagging right now… why you’ll want to have this research before November 3… and three free stock ideas as a thank-you for joining us: two urgent buys and one even more urgent sell.
I’ve changed my approach before when new data appeared. I’m doing it again. And I don’t want you to miss it.
To reserve your spot for our event, RSVP here.
Marc Chaikin
Founder, Chaikin Analytics

