
Your All-New Asset Details Page: More Insights, Less Hassle
Our development team is always working diligently to enhance your experience, and recently, we took a hard look at our most popular page on the TradeSmith Finance platform: the Asset Details page.
We heard your feedback loud and clear, and we’ve made this page easier to navigate and packed with better information.
And in today’s column, I’ll personally take you on a guided tour of this new page.
Plus, if you’d rather absorb new info visually, I’ve also included a video walkthrough of our new asset details page below:
Click HERE to Watch (Length: 26:14)
Whether you’re watching or reading, let’s dive in!
Out with the Old, In with the New
Let’s start our guide with a quick refresher. Here’s one last look at the Asset Details page you’ve come to know, as seen in TradeSmith Finance:
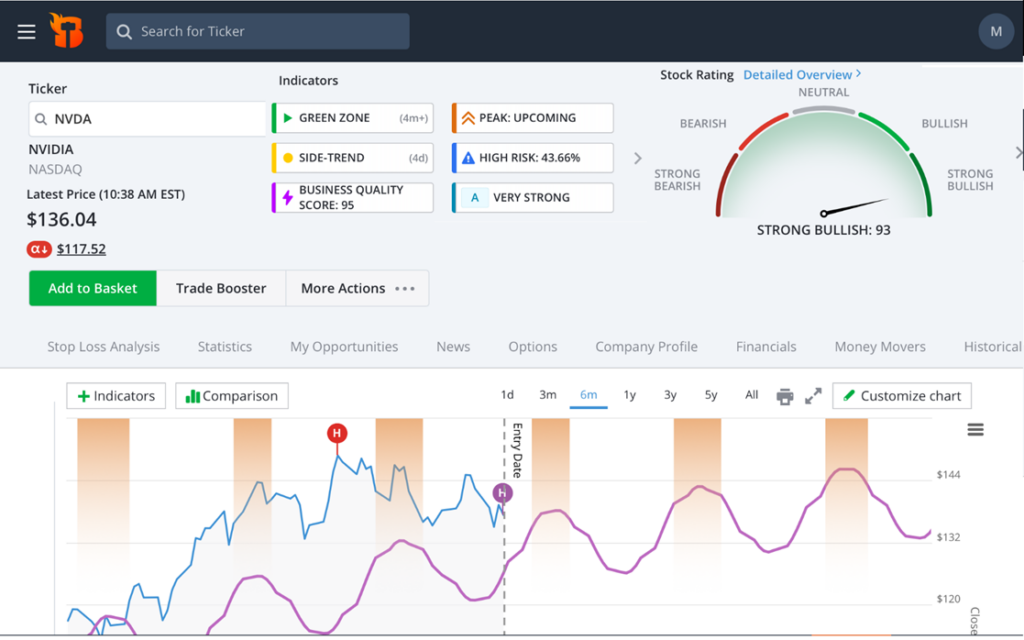
The old Asset Details page required you to click through several links and tabs to get to the information you wanted to view – which was a hassle, especially if you wanted to review quickly.
So, we set out to simplify and streamline your experience.
Enter the all-new Asset Details page – redesigned to make it easier than ever for you to have all the most important data you need at your fingertips. Now, you can more quickly make well-informed investment decisions.
It’s everything you need, all in one convenient location:
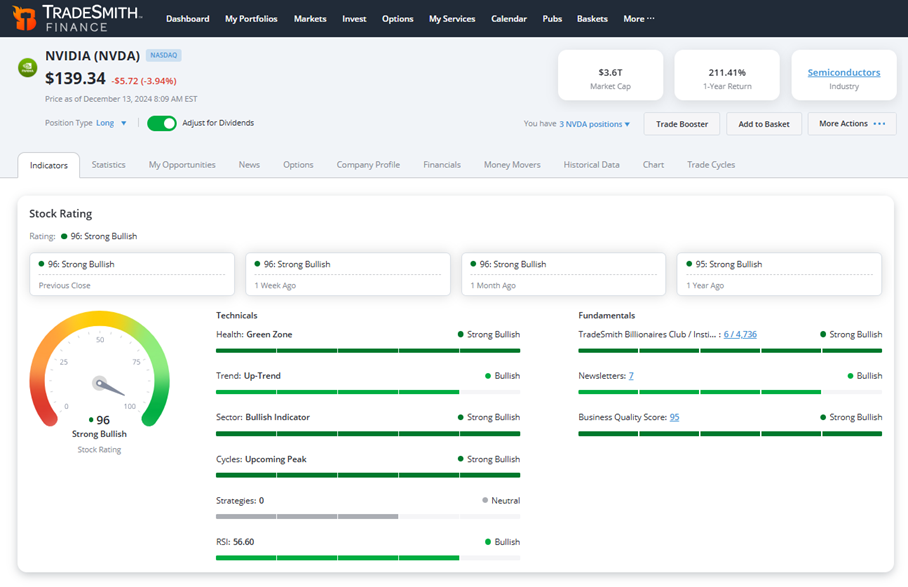
We’re happy to introduce the new Indicators tab — your central hub for all our most valuable indicators, now conveniently located right on the Asset Details page of all your favorite stocks, markets, and commodities.
This tab is the new default view, eliminating the need to navigate across different sections of the site. Simply scroll down the page with this tab open to explore all your key TradeSmith indicators: Health, Trend, Risk (VQ) – along with any other relevant strategies, all at your fingertips.
At the top, in the gray header area, you’ll notice that this page adapts depending on your needs…
- Whether you’re researching a new asset by ticker symbol, or…
- Reviewing an asset already held in your TradeSmith synced portfolio.
For example, the asset detail page shown above for NVIDIA (NVDA) is how it would appear if you did not have NVDA in your portfolio:

You’ll notice it displays the stock’s current market cap, its one-year return, and its industry, which is hyperlinked. If you click on the link, it will take you to our popular Screener tool (if subscribed) to search for similar securities.
On the other hand, if you do hold NVDA in your synced portfolio, the display adapts to show your total gain since it was added to your portfolio – both in percentage (85.42%) and as a total dollar change ($232.26):

To the right, you’ll find it also displays today’s daily change in both percent and dollars.
From this page, you can easily scroll through all your synched portfolio holdings – whether you’re moving forward to Omnicom (OMC) or back to Microsoft (MSFT). This way you can quickly review all your portfolio holdings at a glance.
Next, the new asset page displays all the vital data pertaining to our TradeSmith Stock Rating, plus important technical and fundamental indicators.
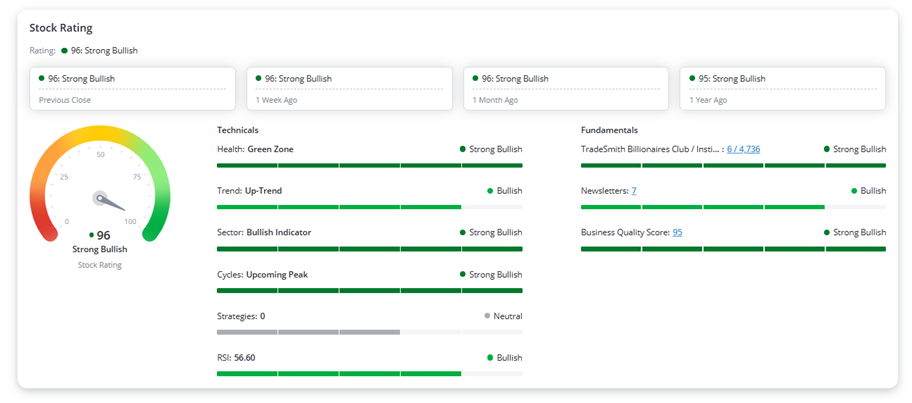
The Technicals section includes current TradeSmith data for Health, Trend, Sector Rating, upcoming cycles, any TradeSmith Strategies the stock qualifies for, and the stock’s current RSI.
In the Fundamental data columns, you’ll quickly see if the stock is part of our TradeSmith Billionaires Club, which newsletter subscriptions you have also recommend the stock, and its Business Quality Score (BQS).
Now, scroll a bit further on the new asset details page and you’ll get even more detail, with interactive graphs on five of our most important TradeSmith proprietary indicators.
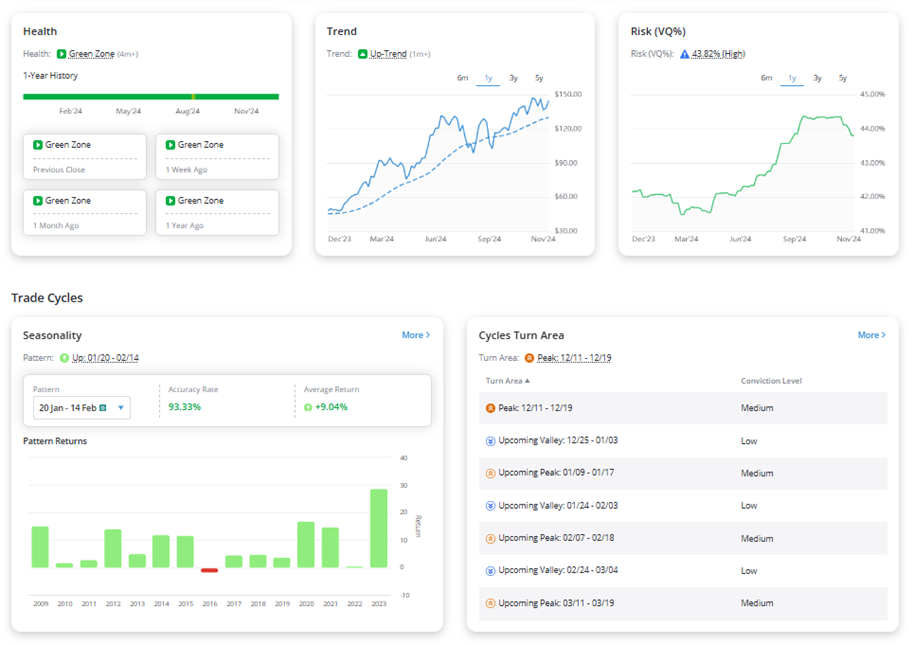
As highlighted above, you can view a more streamlined list of indicators:
- Health: A full 1-year history of the security’s health status, including the green zone entry date and remaining risk.
- Trend: The security’s price trend tracked alongside our Smart Moving Average (blue dashed line), ranging from six-months to the past five years.
- Risk (VQ%): An analysis of the historical VQ over time periods from six-months to the last five years.
- Seasonality: Upcoming bullish seasonal patterns. For example, NVDA shows a bullish period from Jan. 20 to Feb. 14, with a 93.33% accuracy rate and an average return of +9.04%.
- Cycles Turn Area: Upcoming Peak and Valley turn areas for the stock price, paired with the conviction level of each area.
Plus, you can click on the More > hyperlinks for even more detailed seasonal and cycles data.
As you continue scrolling down, you’ll see the new asset details page with two of our most popular strategies: Harmonic Trade Cycles Signals and Predictive Alpha.
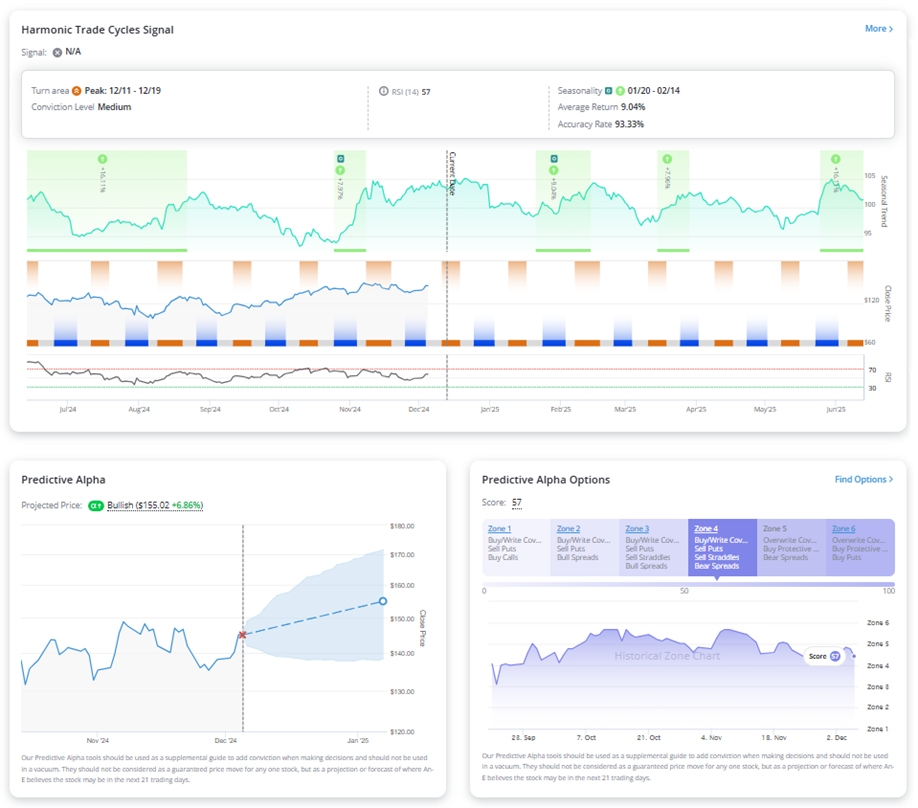
Available to Trade Cycles, TradeSmith Essentials, and TradeSmith Platinum members, Harmonic Trade Cycles combines our uniqe Trade Cycles and Seasonal tools with the powerful RSI technical strategy.
This tool identifies bullish and bearish signals for stocks when upcoming seasonality patterns align with potential cycle price turns- like peaks and valleys – while the Relative Strength Index (RSI) converges at the same time.
Again, clicking on the More > link to access the dedicated Trade Cycles Signal page, where you’ll find more detail on the historical accuracy of various seasonal and cycle patterns.
If you’re a Predictive Alpha subscriber, you can see our AI generated one-month projected price for the security under that header.
And for members subscribed to Predictive Alpha Options, you’ll also find the current options zone level for the security guiding you to the best type of options trades to consider.
Simply click on the blue hyperlinks to explore deeper Predictive Alpha data and find possible options trade opportunities.
Finally, near the bottom of the new asset details page, you’ll find other popular indicators from our TradeSmith programs and our affiliate partners:
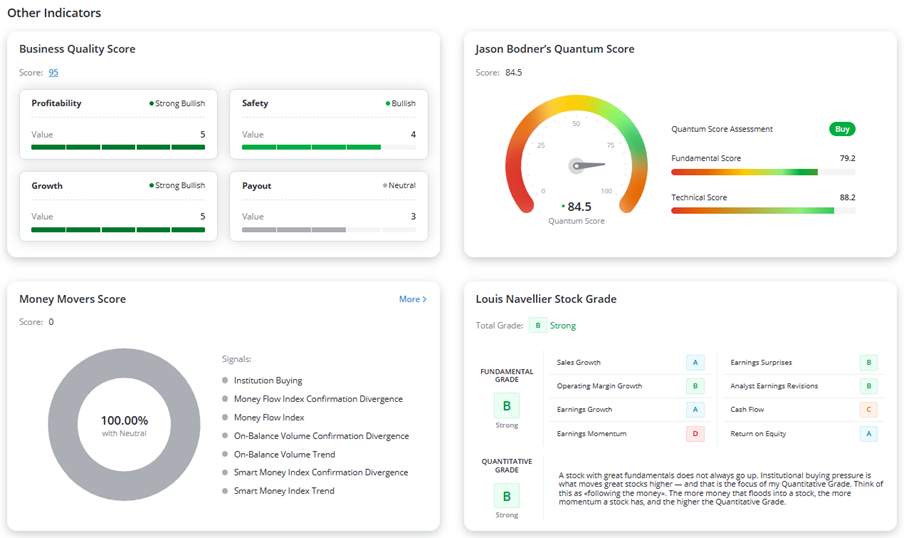
At the top left of the page, you’ll see our popular Business Quality Score, which gives you a quick, detailed snapshot on the quality of any stock measured by a company’s: growth, payout, profitability, and safety – both historically and compared to other stocks.
For more breakdown, simply click on the hyperlinked Score value to see the detail data on each measure that goes into calculating the Business Quality Score.
At the top right, subscribers can see Jason Bodner’s Quantum Score assessment of the security. This includes…
- A Buy signal if applicable…
- Jason’s overall Quantum Score…
- And a detailed Fundamental Score and Technical Scores for each stock.
At the bottom left, you’ll see our proprietary Money Movers Score, which tracks seven separate indicators of money flows into or out of a stock, including…
- Money Flow Index Confirmation Divergence
- On-Balance Volume Confirmation Divergence
- Institution Buying
- Money Flow Index
- On-Balance Volume Trend
- Smart Money Index Confirmation Divergence
- Smart Money Index Trend
Last but certainly not least, Louis Navellier’s quantitative Stock Grade ratings – available to subscribers of any of his services – are featured through our corporate partner, InvestorPlace.
Here, you’ll see a stock’s Total Grade, along with its Fundamental Grade and Quantitative Grade. These are based on eight proven metrics including…
- Sales Growth
- Operating Margin Growth
- Earnings Growth
- Earnings Momentum
- Earnings Surprises
- Analyst Earnings Revisions
- Cash Flow
- Return on Equity
Louis Navellier has used these metrics for years to identify winning stocks with the potential to outperform the market.
Mike Burnick’s Bottom Line: There you have it, folks! The all-new – and much enhanced – TradeSmith Asset Details page! Keep an eye out for more upgrades to our Overview tab page coming your way soon.
In the meantime, if you haven’t watched it yet, check out my guided video tour by clicking here. Exclusively for TradeSmith Insiders, this video will personally guide you through the new asset details page section by section.
Good investing,
Mike Burnick
Senior Analyst, TradeSmith
P.S. In the fast-paced world of investing, knowing when to act is just as important as knowing what to invest in. Both of the indicators we talked about earlier – Fundamental and Technical – are key to making informed decisions.
But the real power lies in combining different layers of analysis. One such tool to highlight was unveiled during The Auspex Anomaly Event, hosted by my colleague Luke Lango over at our corporate partner, InvestorPlace.
Luke’s Auspex system blends fundamental, technical, and sentiment-driven factors to consistently identify top-performing stocks. This strategy has delivered gains every month for the past five months – and thrives in both bull markets and pullbacks. With market volatility expected to continue into 2025, it’s a great time to explore this adaptive approach.