Prepare for the Coming Melt-Up with a New TradeSmith Strategy!
Don’t let the last few days of market weakness scare you away: Stocks are still in the early innings of a powerful melt-up in price – and today’s correction could be tomorrow’s opportunity.
That’s the word from our newest TradeSmith indicator, which tells me it’s right about that time to profit like it’s 1999.
As TradeSmith CEO Keith Kaplan explained at an event last week, our data tells us that we’re right in the midst of a “mega melt-up”: a rare trading signal we don’t often see.
We’ve created an all-new trading strategy to help you take full advantage of this melt-up. And though trade war fears have Wall Street spooked at the moment, today’s volatile markets are a perfect time to get started with this low-risk, high-reward trading strategy.
But more on that strategy in a moment.
First, let’s take a closer look at our proprietary Melt-Up signal – and learn what it means for stocks in the coming months…
Dial “M” for Melt-Up
Below is a chart of the Dow Jones Industrial Index (DJIA), as seen in TradeSmith Finance. Do you see that signal on the chart labeled M? I’ve marked it with a green arrow:
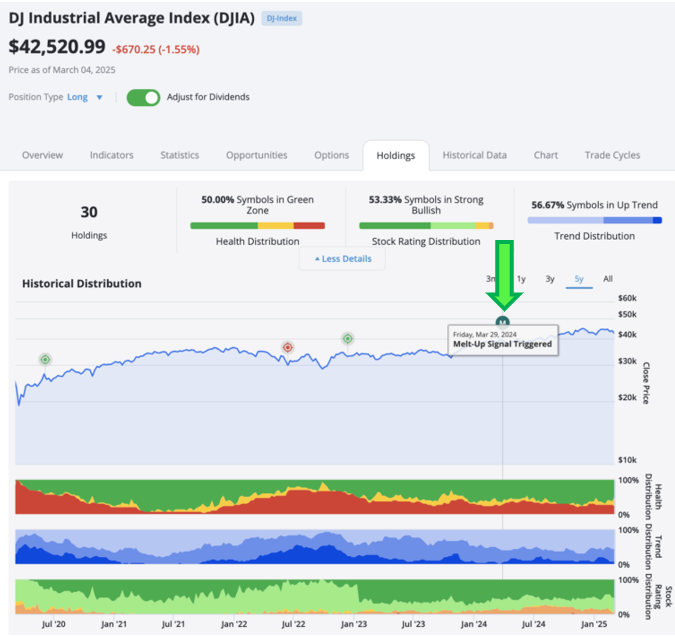
It triggered last year, on March 29, 2024. And what this little signal tells us is that market conditions are perfect for a rip-roaring melt-up in stock prices.
A melt-up is a rapid price increase that typically occurs near the end of a bull market before a significant correction or crash. So, M marks the spot for this Melt-Up Signal, a new TradeSmith market alert for major indexes including the S&P 500 (SPX), Dow Jones, and the Nasdaq 100 Index (NQQ).
We’ve designed this new signal to identify the times when the market is in the final stages of a bull market. That’s when stocks often experience what’s called a “blow-off top.”
That may sound scary at first… but a blow-off top can produce the buying opportunity of a lifetime for savvy investors and traders. You see, melt-ups are rare: There have been just seven Melt-Ups in the Dow Jones Industrial Average since 1990.
So, when these opportunities come around, it’s critical to make the most of them… and you’ll want to take note of this: New Melt-Up Signals have triggered for both the S&P 500 and the Nasdaq 100.
So, if high stock market valuations, trade war fears, and the market’s latest run of elevated volatility all have you worried about a market melt-down, you can take a deep breath: The historical data tells us to expect a potentially powerful melt-up in stock prices first, before the music stops.
Remember that volatility cuts both ways. It’s important to be prepared for corrections, but it’s just as important to be prepared for the opportunities that follow.
Upside volatility during a market melt-up can be your best friend. And longtime traders and investors like me have experienced this first-hand.
In a recent issue of Inside TradeSmith, I pointed out that high valuations are practically useless as a short-term market timing indicator.
For example, the last time we had a melt-up signal for the Nasdaq 100 was after the COVID-crash in 2020. And from the time our TradeSmith signal flashed six months later, the Nasdaq went on to rally 47% over the next 14 months.
But that was nothing compared to how the Nasdaq 100 partied back in the 1990s.
From 1995 to 2000, the Nasdaq 100 went up 1,000%. But it wasn’t a straight shot up.
In fact, there were more than two dozen major pullbacks across that five-year period, including several “official” bear market declines – points when the Nasdaq fell 20% or more from its peak.
But each pullback proved to be an incredible buying opportunity!
In 1995 alone the Nasdaq 100 rose almost 40%. And the next year, it tacked on another 22.7%.
The index gained 21.6% in 1997 and 39.6% in 1998, but there were three large pullbacks of 20% or more sandwiched between those big gains – a -20% pullback in ’97, and two drawdowns of -22.2% and -19.1% in ’98, both within six months.
But the traders who hung in there were richly rewarded when stock partied in 1999.
After the ’97 and ‘98 pullbacks, stocks went absolutely parabolic in ’99, with the Nasdaq 100 soaring 101.95% that year… the biggest annual gain ever.
Of course, we all know the 1990s melt-up ended badly, followed by the 2000-2003 bear market. And today’s melt up will most likely end badly too… someday. But probably not today.
That’s because we’re just getting started. Our latest Melt-Up Signal for the Nasdaq 100 triggered at the end of September – which means two major markets are in melt-up mode:
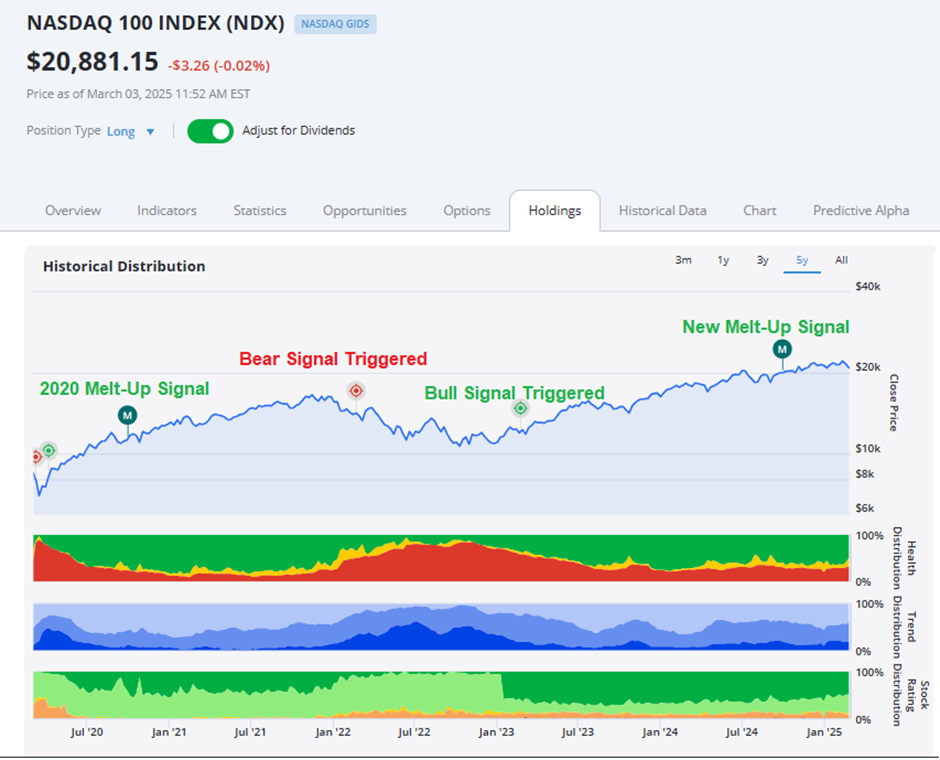
This means that we are barely five months into this new signal and could still look forward to the parabolic market moves that melt-ups like this have produced in the past: After all, these moves generally occur over a four-year time frame.
The big takeaway is that you can’t have a massive melt-up without massive price swings along the way. It’s simply the price you pay for the kind of extraordinary gains that markets can deliver during a melt-up.
With a new signal flashed on the Nasdaq, now is the time to take full advantage of the advance notice. And here at TradeSmith, we’ve added new tools to help you fully profit from a market melt-up – and most importantly, to warn you when it may be time to move to the sidelines.
TradeSmith’s Trade360, our all-in-one software suite, is specifically designed to help you make the most out of every market environment.
And two big upgrades have recently made it the perfect trading tool for the melt-up market period we’re in right now.
The first is our proprietary Melt-Up Signal. That’s the signal I showed you before: It clearly identifies the major market indexes that are in melt-up mode and alerts you when market melt-up conditions change… so you don’t overstay your welcome at the party.
With this alert, you don’t have to second-guess whether we’ve seen a market top or not. You’ll get a warning that tells you when it’s time to get out – before stocks sink.
Profit from Drawdowns with the Snapback Strategy
The Melt-Up Signal is only the first of the two major updates to Trade360.
Alongside it, we’ve created an advanced trading strategy that’s perfectly suited to melt-up environments: the TradeSmith Snapback Strategy – which was just added to Ideas by TradeSmith and is available to Ideas, Trade360, TradeSmith Essentials, and TradeSmith Platinum members.
This bullish stock strategy can help you capitalize on bearish market moves, like all those drawdowns that markets experienced in the late 1990s on the way to higher prices.
We’ve designed the Snapback Strategy to take advantage of short-term, extreme pullbacks in otherwise high-quality stocks.
When prices fall by a certain amount and at a certain pace, our strategy flashes a buy signal… and sells the stock 21 trading days later.
We tested this simple strategy on the S&P 500, on pullbacks going back 10 years. The strategy delivered wins 80% of the time – and the average return, counting both wins and losses, was about 16%!
Here’s how to access the Snapback Strategy stock signals:

After logging into your TradeSmith Finance dashboard, simply click Invest on the TradeSmith main menu bar, then select the Opportunities tab. Next, from the dropdown menu labeled Strategies, select Ideas Lab, then scroll down and click on Snapback.
This shows you the top 20 results that qualify for our Snapback strategy. The top five stocks in ranked order are shown in the screenshot below:
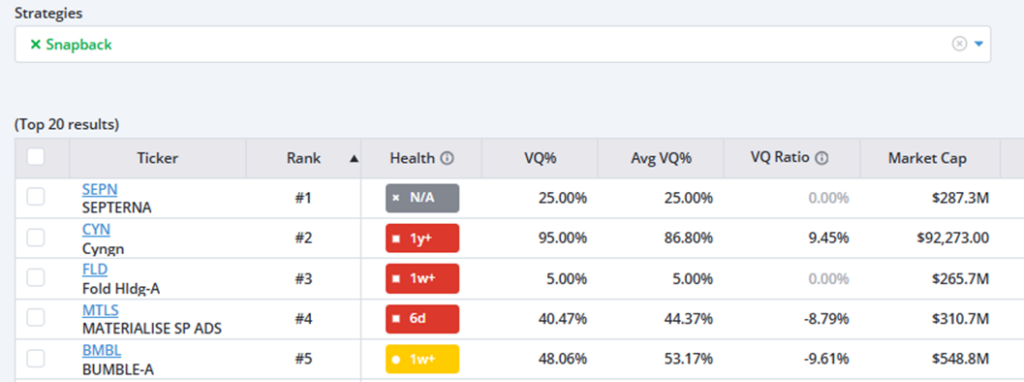
All five of these stocks have fallen sharply in recent months – and each is due for a return from the lows.
We just rolled out this new Snapback strategy to our Trade360, Ideas by TradeSmith, and TradeSmith Platinum members last week. These members get new entry signals for individual stocks that qualify for the strategy, including the five shown above – along with strict exit criteria, to know when to sell.
This strategy works whether stocks are in a bull market or a bear market… as it targets those rare occurrences when certain stocks reach irrational extremes. That’s a strong edge to have on your side in volatile markets.
And it makes for a great swing-trading strategy, as you buy into the downside dips and profit from the upside rips.
Mike Burnick’s Bottom Line: Our data tells us the stock market is about to party like the 1990s, which means a feast of trading opportunities are on the way. Our latest Trade360 updates add new strategies that aim for quick, swing-trading gains along the way – to keep you profiting as long as the melt-up signal lasts. Don’t miss out on the profits party.
Good investing,
Mike Burnick
Senior Analyst, TradeSmith
P.S. After the intense volatility we’ve seen from the market this week, the Nasdaq’s recent Melt-Up Signal is a promising sign… and the start of a great opportunity for those traders savvy enough to make the most of it.
That’s where TradeSmith’s powerful Trade360 strategies and tools come into play – and for those eager to make the most of the mega melt-up we’ve spotted on the horizon, TradeSmith CEO Keith Kaplan has all the details.
Last week, Keith held The Last Melt-Up event – where he debuted the new Trade360 Melt-Up Signal and shared his latest research into this rare market opportunity.
As part of his research demonstration, Keith showed how he uncovered the mega melt-up, explained how he’s preparing members to take advantage of it, and even shared a few stocks to follow or stay away from as the melt-up develops.