Here’s What the Latest Job and Inflation Data Means for Your Investments
Recent economic reports have turned subpar lately – and it paints a darker picture.
This sour string of data includes recent declines in the Purchasing Managers Index (PMI) for both manufacturing and service sector businesses. But it was last Friday’s jobs report that really landed with a thud.
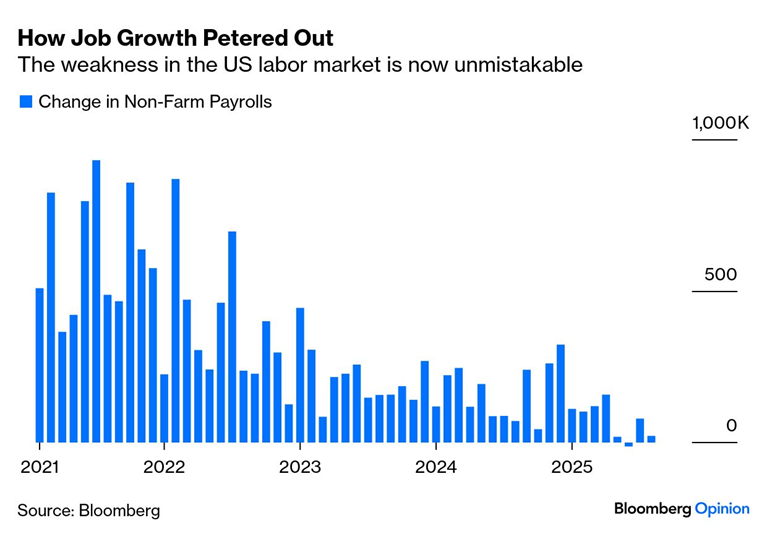
Last month’s new job gains totaled just 22,000, less than one-third of what was forecast, as the unemployment rate ticked up to 4.3%.
And as if that weren’t bad enough, further downward revisions to employment data from June and July subtracted another 21,000 jobs from previously reported data.
As you can see below, job growth over the last three months has stalled out, averaging just 29,000 new payrolls added per month. That’s well below the 100,000 or so that is considered healthy for an expanding job market:
At least, that’s what we thought was going on as we entered the week.
Last month, I covered the dramatic downward revisions made to the June and July job reports by the U.S. Bureau of Labor Statistics (BLS) – the same revisions that led to the BLS Commissioner getting canned shortly after their release.
Well, it seems that the BLS had one more bombshell to drop: Earlier today, the agency released a report noting that during the period between April 2024 and March 2025, the U.S. economy added 911,000 fewer jobs than had been previously reported.
This data suggests that there has been a stark difference between the understood health of the economy and the true health of the economy. And that’s a difference we’ll need some time to process, as dire as it may seem.
The good news, though, is that stocks have rallied – at least initially – in the face of this data. That’s based on the notion that rate cuts are now a sure thing:In other words, that there are now 100% odds the Fed will cut short-term interest rates at next week’s policy meeting.
Granted, after Friday’s poor jobs report, stocks ended up reversing lower by the close – as markets processed the reality that the U.S. economy suddenly appeared weaker than previously thought. And we’ll have to wait and see how today’s bombshell revisions affect prices in the coming days.
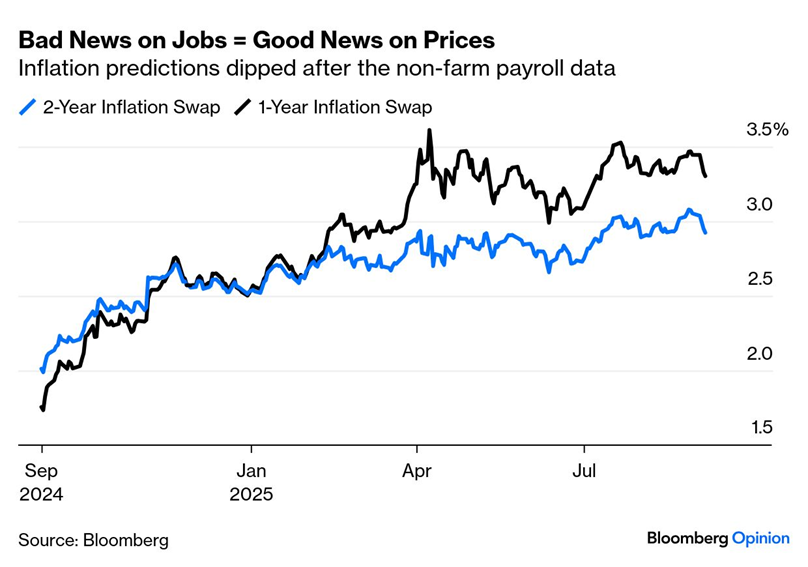
But what’s bad for the economy is good for bond prices – and for the inflation outlook.
As you can see below, expected inflations – for periods both one- and two years from now – fell after the dismal employment report last week. And the one-year swaps now appear to be trending down after peaking in April:
Let’s hope that trend continues, because this will be a busy week for new inflation data. There’s more reports coming down the line!
Wednesday’s Producer Price Index (PPI) is expected to show more upward pressure on prices, after jumping 3.3% year over year in July.
In other words, American businesses are already paying higher prices for both goods and services – due mainly to import tariffs.
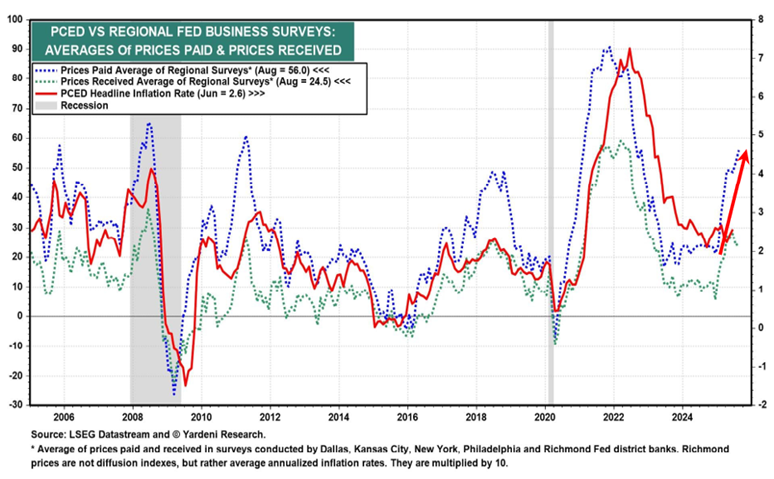
Eventually, this upward price pressure gets passed on to consumers. Otherwise, corporate profit margins decline. That causes stocks to miss earnings estimates, and that’s a bad outcome for the market.
And speaking of consumers… the latest Consumer Price Index (CPI) report drops a day later, on Thursday morning. Another hot Core CPI reading is expected this week, with analysts looking for an increase of +3.05% year over year. That would be on par with July’s 3.1% core CPI gain.
The concern is that the Fed is positioned to cut short-term rates next week, just as both consumer and producers prices are gaining upside traction…
We’re on track to see a repeat of That 70’s (Inflation) Show.
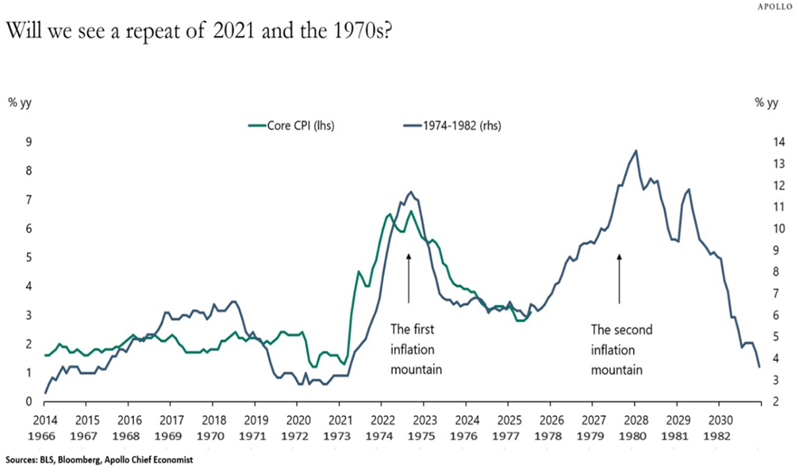
During that “lost decade,” inflation increased steadily in the early 1970s. Then the inflation rate declined for a while, only to surge much higher again in the late 70s – and into the early 1980s.
A second wave of inflation after the intital post-pandemic shock is exactly the nighmare scenario that keeps Fed officials awake at night. All eyes will be on next week’s Fed meeting – that’s for sure.
So, with that all in mind, what’s the best way to defend your wealth against another unexpected wave of inflation?
Well, never forget that stocks themselves can be a wonderful inflation hedge… at least if you own the right type of stocks.
In fact, corporate sales and profit results are already getting a boost from higher selling prices. Just as long as production costs don’t climb faster than increased sales, then profit margins can rise.
In my opinion, now is the time to consider allocating your stock holdings to favor inflation-resilient stocks.
With that in mind, I have a TradeSmith screener in mind, that will scan our database for high-quality stocks with strong free cash flow and consistent profit margins which gives them pricing power.
In other words, inflation resilience!
These are stocks that often have durable competitive advantages, with resilient sales and steady profit growth. That means these firms can more easily raise prices when inflation rises, to preserve their profit margins and maintain quality earnings.
Here’s how to use it.
Seek Inflationary Safe Havens with the TradeSmith Screener Tool!
To get started, be sure to log in to your TradeSmith Finance dashboard, then select the Invest page from the navigation bar at the top of the screen.
Next, click the Screener tab on the following page to access our customizable market-scanning tool.
As a reminder, you must be subscribed to Trade360, TradeSmith Platinum, or Ideas by TradeSmith to have access to this powerful tool.
If you don’t see this tool on your platform, but would like to, simply call 888-623-0858 to speak with our Customer Care team and learn how to get access. Then you can build your own stock screeners with just a few clicks!
In the Screener menu, click the + Add Filter button to customize your search. Below, you’ll see a screenshot of my inflation-resistant stock screen:
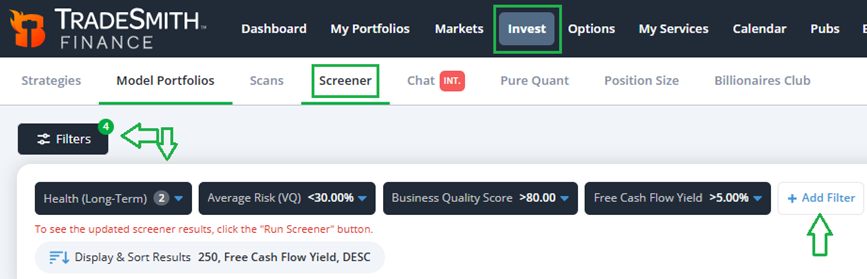
You can use this as a standalone inflation-resilient stock screener. Or, you can use some or all of these filter settings to add to your own favorite screens and make it your own!
As you can see, I’m looking for healthy stocks (in the Health Indicator Green and Yellow Zones) with average or lower volatility, as measured by our TradeSmith Volatility Quotient (VQ%).
A VQ% reading of 30 to 15 is considered medium risk. And below 15 is in the low-risk zone. We calculate this according to each stock’s unique volatility profile and trading history.
Next, I want to zero in on stocks with a Business Quality Score (BQS) of 80 or higher. This measures each stock’s profitability, sales & profit growth, financial strength, payout and many other fundamental factors.
Higher is better, and a BQS greater than 80 means we’re dealing with the cream of the crop, the top 20% of stocks we rank for quality.
Finally, I insist on stocks with high Free Cash Flow yields of 5% or more. For comparison, the average S&P 500 stock has a free cash flow yield of about 3%.
Strong Free Cash Flow generation makes for stocks with real pricing power – which means our results will be shielded from inflation to a greater degree.
When I ran this screen yesterday, I found 56 stocks that made the cut. Here’s a screenshot of the top 15 stocks that made the list, sorted by Free Cash Flow yield descending (highest first):
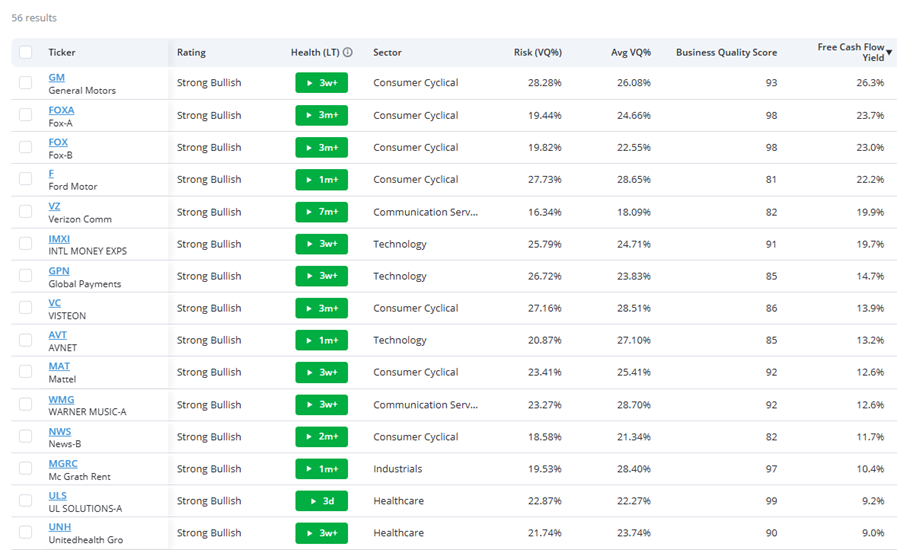
As you can see, there are quite a few blue-chip stocks represented from various sectors including technology, consumer cyclicals, communications and health care.
It’s a diverse list of cash-rich, inflation resilient stocks… and as the situation develops, these same stocks could be a great defense against a second run of inflation.
Bottom Line: If we do experience a second-wave inflation shock, be sure to seek shelter in high quality, inflation resilient stocks like the ones we’ve found today.
These are companies that have demonstrated strong pricing power, with equally strong profit margins and rich free cash flow yields. Stocks like this can not only survive higher inflation – but thrive in it by taking market share from competitors.
Good investing,
Mike Burnick
Senior Analyst, TradeSmith
P.S. The latest run of economic data paints a darker-than-expected picture of the U.S. economy – and it’s brought the specter of 70s-style inflation shock along with it.
The TradeSmith Screener we built today can help you find inflation-resilient stocks across the market to help you weather any could-be inflationary storms that could hit your portfolio… but even in the worst-case scenario of stagflation, you shouldn’t keep a fully defensive portfolio.
Instead, it’s key to pick up stocks with the highest potential for profit. And when inflation shocks are on the table, it’s even better if you can expand your investment timeline, too.
No one knows that better than my colleague Eric Fry, Senior Analyst at TradeSmith’s corporate partner, InvestorPlace.
Over his career, Eric has delivered 41 recommendations that each soared 1,000% or more – all by focusing in on those high-potential opportunities hiding in the market’s sweet spots. Now, Eric has developed a formula to identify these high-potential stocks, and he’s built a breakthrough system to zero in on those rare opportunities.
His goal is to hopefully add the 42nd, 43rd, and higher quadruple-digit gains to his repertoire – and he’s eager to share the gains with as many people as possible via his 10X Breakthrough event being held tomorrow, Wednesday, Sep. 10 at 10 a.m. ET.
Eric’s system has already identified five new stocks in that sweet spot, primed to potentially 10X in size – and Eric is revealing all five tickers for free during his presentation.
Click HERE to register for tomorrow’s event. You won’t want to miss it!