Your Fourth “Lesson” in TradeSmith: Earning Consistent Income With Options360
Warren Buffett may just be the world’s most famous investor: “The Oracle of Omaha” spent nearly sixty years as chairman of Berkshire Hathaway before retiring in January 2026, and he’s been one of the top 10 richest people on the planet since 1992.
Talk about a successful career!
Now, Buffett is often considered the very definition of a conservative investor. He would routinely demand a “margin of safety” for every stock he bought, and he was legendarily cautious about approaching new investments. You’ve heard his first rule of investing – “Don’t lose money.”
So, it might surprise you to know that while Buffett ran Berkshire Hathaway, he frequently traded options.
But rather than buying options to speculate on new positions, Buffett sold options on stocks he wanted to buy at a discount, earning income in the process.
For example: In the 1990s, as Buffett was building a large stake in Coca-Cola (KO), he sold put options on the stock, promising to buy five million shares at $35.
In return, Buffett earned $7.5 million in cash, up front, while he aimed to buy more shares at a discount. All that with a single trade.
It’s true that trading options can be risky, depending on how you use them. Some traders like to speculate with options for a chance at a windfall, even though it may be a longshot. But many other traders use options as a useful tool:
- Options can be used to hedge your stock portfolio against risk and protect profits…
- Options are a handy way to leverage your cash – it costs $5,000 to buy 100 shares of a $50 stock, but only about $500 to buy a call option on the same stock…
- And options can be used to earn recurring income, by selling puts or covered calls on stocks.
This third method of selling options to generate income has always appealed to me in a big way. For my money, selling put options on quality stocks, just like Buffett did with KO, is the best way I know of to earn consistent income from the stock market – even in uncertain markets.
And with TradeSmith at your side, you can turn that Buffett-approved strategy into daily payouts.
Last week, in the third part of our “TradeSmith 101” series, we covered my favorite TradeSmith tool – the TradeSmith Screener. Today, we’ll continue our journey through TradeSmith with a deep dive into our Options360 suite of tools, screeners, and advanced algorithms.
These cutting-edge tools help you trade options smarter, not harder, by pinpointing high-probability opportunities you can use every single trading day. And as your go-to guide to Options360, I’ll walk you through everything you need to know to get started.
Your Next TradeSmith Walkthrough: Turning Market Insights into Actionable Strategies
We’ve got plenty to cover in today’s issue – but there’s more to learn this week! As a reminder, your next TradeSmith Walkthrough webinar is coming up in just a few days.
THIS THURSDAY, April 16, at 1:00 p.m. Eastern, join TradeSmith Product Education Lead Marina Stroud for a hands-on session on turning technical, fundamental, seasonal, and AI-driven insights into clear, repeatable strategies.
In this session, you’ll see real TradeSmith tools in action as we cover practical strategies to approach the market with confidence and discipline, using our Predictive Alpha and Trade Cycles tools for both long-term investing—using Health, Risk, and Trend analysis—and shorter-term trading.
Click here to register for Thursday’s webinar. We hope to see you there!
Search With TradeSmith’s Powerful Options-Scanning Algorithms
At the core of Options360 are two powerful indicators:
- The Probability of Profit (POP) – which tells you the odds of a trade closing in your favor, to bring clarity to your decision-making…
- And the Return on Investment (ROI) – which shows the profit potential of a trade relative to the funds you invest, helping guide you to high-efficiency option trades.
Our proprietary market-scanning algorithms search through the options chains of stocks across the market, identifying the POP and ROI of every potential trade you could take.
Armed with these metrics, you can enter options trades with more clarity and confidence – and a measurable trading edge.
Let me illustrate how these two indicators can stack the odds of success in your favor…
We’ll use a modern example: Let’s say you’d like to own Nvidia (NVDA). The shares have pulled back more than 7% from the November 2025 highs, and the stock looks cheap now.
NVDA trades over 30x earnings now, but earnings and sales are growing at 65%!
So why not buy one of the world’s most valuable companies at a discount?
Well, based on the data from our Options360 software, with NVDA stock trading above $188 a share you could sell a put option expiring in May and agree to buy NVDA at $165. That’s roughly a 12% discount from current prices… and you could get paid $135 upfront for the opportunity!
To take a closer look at this potential trade, simply log in to your TradeSmith Finance platform. From your Dashboard, type NVDA into Search for Ticker box in the top right of the screen, then click the ticker to open NVDA’s Asset Details page.
Next, click the Options tab to review NVDA’s options chain. Select Sell Put from the options strategy menu at the top of the tab, and you can scroll down to find various put options to choose from:
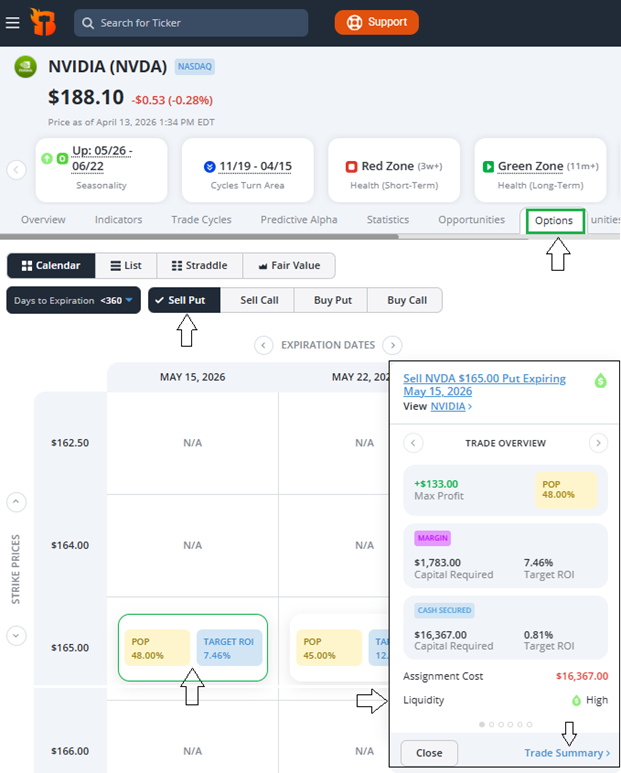
Click on any option to see a brief trade summary, as shown above.
The NVDA $165 Put Expiring May 15, 2026 looks like a good candidate for a put-sell trade, as we look to get paid while waiting to buy NVDA shares at a discount.
Here’s what the Trade Summary window tells us:
- By selling this put option, you receive a Max Profit of +$133 – that’s the cash you’re paid upfront upon selling the option contract…
- The Probability of Profit (POP) of the trade is 48%. In other words, our Options360 system sees roughly a 50/50 chance that NVDA falls below the $165 strike price by the expiration date…
- We also can see the Margin and Cash Secured capital required to enter this trade: $1,783 in a standard margin brokerage account, or $16,367 in a cash-only account…
- Along with the Target ROI for both the margin and cash-only approaches. For example, if the option expired worthless and you kept just the $133 in premium, you would see a 7.46% return on your margin.
By selling this put option, you would get paid the option premium of $133 upfront, deposited straight into your brokerage account. In exchange, you would agree to buy 100 shares of NVDA per option contract sold, at a price of $165 per share, if the stock fell below the $165 strike price. The contract would be in effect until market close on Friday, May 15, 2026 – or until you bought back the put option.
With the goal of picking up cheap shares of NVDA, that’s not a bad deal: If NVDA falls below the strike price, that’s a 12% discount on 100 shares of a stock to hold for the long-term. And if it doesn’t, then that’s $133 in the pocket for the trouble of waiting.
But let’s say you already own 100 shares of NVDA, and you’re looking for a way to earn additional income from your stock holdings. Why not sell a covered call option?
Let’s return to the Options tab for NVDA, but this time select Sell Call from the options strategy menu and scroll down. Once again, we can click on any option to see a brief trade summary…
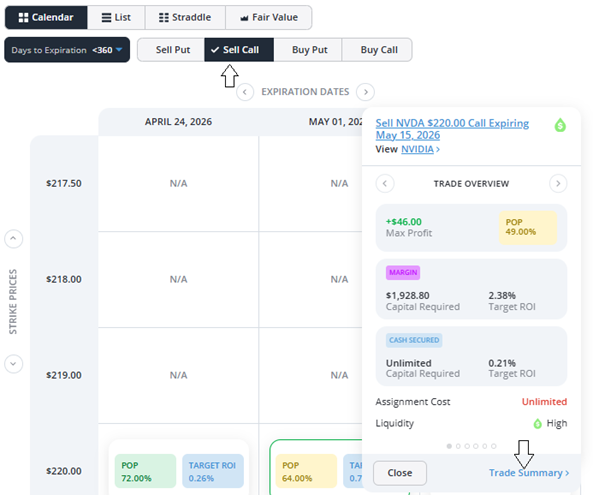
The NVDA $220 Call Expiring May 15, 2026 looks like a good candidate for a covered call strategy – and for earning extra income on existing NVDA shares.
Here’s what this Trade Summary window tells us:
- By selling this call option, you receive a Max Profit of +$46 – again, that’s cash paid upfront…
- While the Probability of Profit (POP) of the trade is 46%. That means slightly less than a 50/50 chance that NVDA rises above the $220 strike price by the expiration date…
- We also can see the Margin capital required to enter this trade: $1,928.80 in a standard margin brokerage account, if you don’t own the stock. But since you already own 100 shares of NVDA stock, the sell call is “covered” by your shares. So, no extra capital should be required by your broker if you just sell one covered call.
Once again – that sounds like a good deal to me! If NVDA rises above $220 by May 15, 2026, you would lock in your profit while being paid an extra $46 in the process. And if NVDA stays below $220 by market close on May 15, even by just a few cents? You keep the $46 – and your shares.
Using our Options360 tools, you can find dozens of opportunities like this every single day.
And you don’t need to target a specific stock to find these opportunities, either: From your TradeSmith Finance dashboard, simply click on Options in the main menu bar, then click on the Opportunities tab in the sub menu. Then you can let our algorithms find opportunities on your behalf!
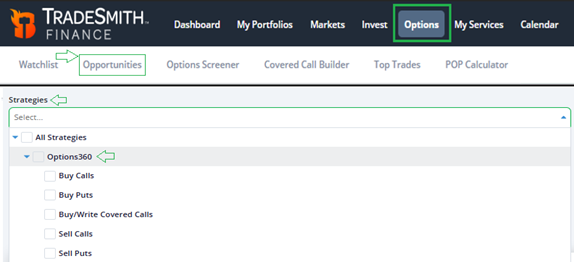
Simply select the type of option trade you wish to make (buy calls, sell puts, etc.) from the Strategies dropdown menu, and then you’ll see the top options for each of those strategies according to our Options360 algorithms, as shown below:
Please note that these options opportunities are available only to members with subscriptions to Options360 or TradeSmith Platinum. So, to get full access, simply call us at 888-623-0858 to learn more.
Build Your Own Option Trades
While the Opportunities page gives you plenty of ideas to choose from, you don’t have to scroll through pages of options to find those with the highest probability of profit.
Instead, you can leave the driving to us with our exclusive options Trade Builder feature. This valuable tool is designed to help you quickly identify options trades that align with your own market outlook.
Whether you’re bullish or bearish, trading in the short-term or looking for a long-term investment, the Trade Builder provides clear, actionable trade ideas tailored to your preferences. To access the tool, click the Trade Builder tab on the Options page:
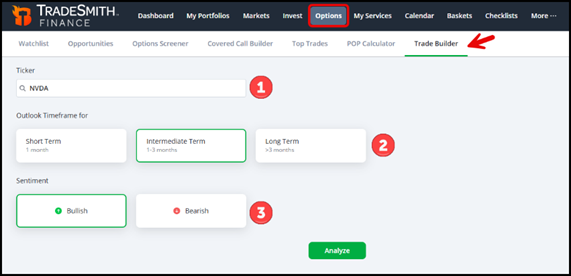
Here’s how it works in 3 simple steps:
Step 1: Enter Your Ticker Symbol
Start by entering the stock symbol you want to analyze.
Step 2: Select Your Timeframe
Choose the time horizon that matches your outlook:
- Short-Term: Typically, one month or less.
- Intermediate-Term: About one to three months.
- Long-Term: Three months or more.
Step 3: Choose Your Sentiment
Decide whether you are Bullish (expecting the stock to rise) or Bearish (expecting the stock to fall).
Now simply click the Analyze button, and from there, Trade Builder scans the market to identify options that fit your specific criteria. The overview tab shown below will provide you with details:
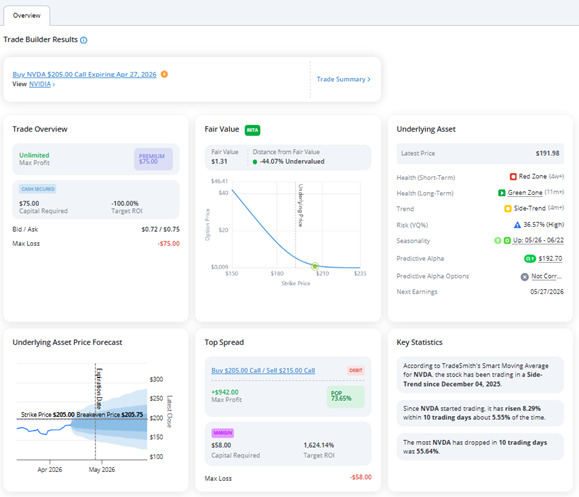
Here, I’m looking for a short-term, bullish option trade on NVDA. Our system selected a potential buy call trade and a spread trade.
The call trade – buying the NVDA $205.00 Call Expiring Apr 27, 2026 – is more speculative, because NVDA must be above $205 by the April 27 expiration date for me to profit.
On the other hand, the spread trade – simultaneously buying the NVDA $205.00 Call Expiring Apr 27, 2026 and selling the NVDA $215.00 Call Expiring Apr 27, 2026 – is much less speculative.
Spread trades combine the act of selling one option (in this case the NVDA $205 call) with the act of buying another at a different strike price (in this case the NVDA $215 call). Options spreads reduce your capital requirements to place a trade, and in some scenarios can set a hard cap on your losses in the process – in exchange for a cap on your profits.
In this case, the margin capital required to enter the trade is just $58. The trade has an attractive POP of 73.65%, and has a Max Profit of +$942.
With access to our Options360 suite, you can also use our Options Screener – in the tab next to Opportunities – to search for option trades that meet specific option and underlying asset filters that you choose…
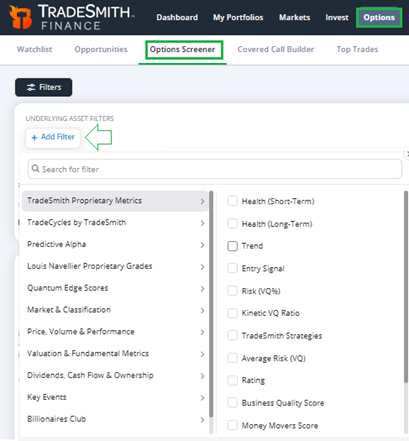
And just like the standard TradeSmith Screener tool we covered in our last issue, you can enhance your search with any number of filters, TradeSmith metrics, and other indicators.
Even More Options Opportunities!
Our algorithmic Options360 engine crunches the numbers on thousands of stocks, and hundreds of thousands option contracts, scanning for high-probability trade ideas tailored to your style.
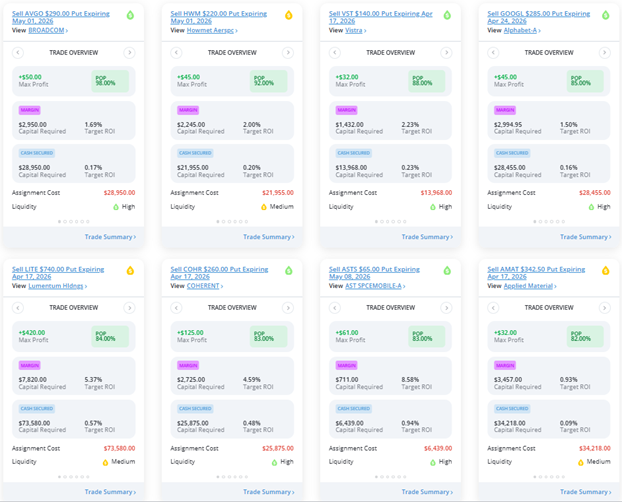
These trades are delivered to you on a daily basis through our Options360 Top Trades page:
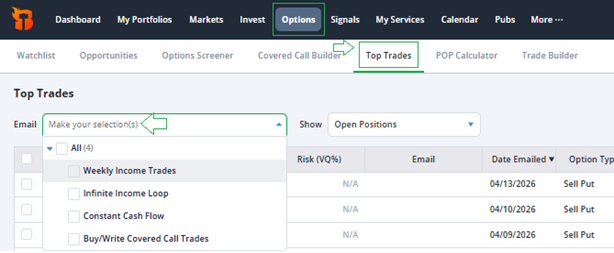
This includes a wide variety of option trades hand-picked by our Options360 algorithms in the following categories…
- Weekly Income Trades, including our top sell put trades to earn immediate premium income,
- Buy/Write Covered Calls: Generate income by selling calls on stocks you already own,
- Constant Cash Flow, a dedicated option trading service that features daily sell put and spread trades,
- And Infinite Income Loop, a streamlined version of Constant Cash Flow with weekly sell put and spread trades.
And for those of you looking for some guidance while making regular options income, good news: Alongside the rest of the Options360 team, I personally oversee trades in both Constant Cash Flow and Infinite Income Loop as the service analyst.
Each option selected for Constant Cash Flow and Infinite Income Loop must meet strict metrics, including a Probability of Profit (POP) of 75% or more, plus higher Max Profit and margin Return on Investment (ROI) metrics. In Constant Cash Flow, we send you the best sell put options and options credit spread trades available, delivered to your email inbox just like this, every trading day:
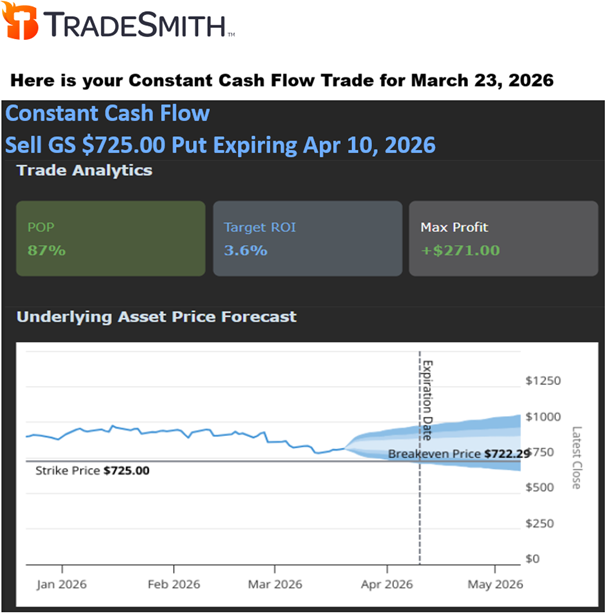
Plus, my team and I manage each trade from entry date through option expiration date, so you’re fully informed every step of the way.
Mike Burnick’s Bottom Line: Our Options360 suite of tools takes the mystery and guesswork out of options trading. With analysis based on the hard data, and guidance from our finally tuned algorithms, you can quickly uncover opportunities to buy and sell options to earn consistent income – giving you access to Buffett-approved strategies with a higher probability of success.
Good investing,

Mike Burnick
Senior Analyst, TradeSmith
P.S. Everything we’ve covered is the result of more than 21 years of building, refining, and improving TradeSmith’s tools and technology. And we’re not slowing down. If there’s something investors need – we create it.
And right now, our team is working on what could be our next big breakthrough… powered by AI.
I can’t share much yet but imagine evaluating a trade before you place it – knowing its potential return, expected timeline, and historical success rate.
More clarity. More confidence. Stay tuned – we’re just getting started.