Your Third “Lesson” in TradeSmith: Find Winning Stocks with Screener 101
In today’s AI-powered internet age, investors are drowning in available information.
But despite all the data at our fingertips, we’re thirsting for knowledge.
Not just raw data – there’s plenty of that online. The problem is, too much of that raw data is useless… or worse, it’s inaccurate.
What investors truly need is data with context: objective insights they can use to gain an edge in the markets.
That’s where TradeSmith comes in: we’ve made it our mission to provide accurate historical financial data and present it in a useful, easy-to-use format for everyday investors.
And as we covered earlier this week, in the second part of our “TradeSmith 101” series, having the right strategies and tools in place – like those provided by TradeStops and our Health Indicator – can help you to manage risk, stay disciplined, and protect your portfolio.
All before you even place a trade.
Now, with our exit strategies firmly in place, and a good sense of the market environment, we can get right back to the fun part of investing: finding new opportunities to profit.
That brings me to our Screener tool, one of the most powerful features on the TradeSmith platform – and the focus of today’s “TradeSmith 101” issue.
The TradeSmith Screener tool allows you to filter through thousands of stocks – and hundreds of thousands of data points – using a wide range of technical and fundamental filters.
This includes a treasure trove of proprietary TradeSmith indicators you can easily use to uncover stocks with big upside potential. And by creatively mixing and matching these indicators and filters, you can tailor these searches to fit almost any investment strategy.
Mastering the Screener will save you countless hours of manual analysis.
You can quickly eliminate stocks that don’t measure up to your preferences – and you can instantly zero in on stocks that make the grade, all according to your own investment criteria.
So, let’s dive right into the TradeSmith Screener, with a step by step guide on how to use my favorite TradeSmith tool.
Why This Powerful Screener Changes Everything
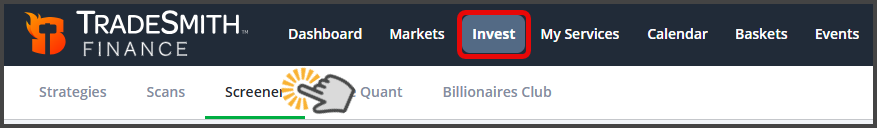
To access the Screener tool, simply click Invest from the main menu bar of your TradeSmith Finance platform, then select the Screener tab.
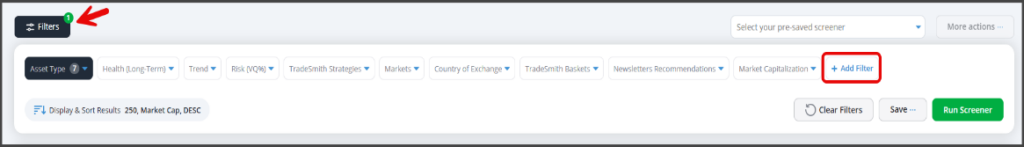
The Screener tool’s homepage displays the most commonly used filters by default. You can apply some or all of these filters, or add more of your own, by clicking the +Add Filter button.
When you click the +Add Filter button, a window will open displaying available TradeSmith proprietary metrics.
Keep in mind that the available filters may vary depending on your subscription.
You’ll find a range of categories, including technical, fundamental, market-based, valuation, performance filters and much more:
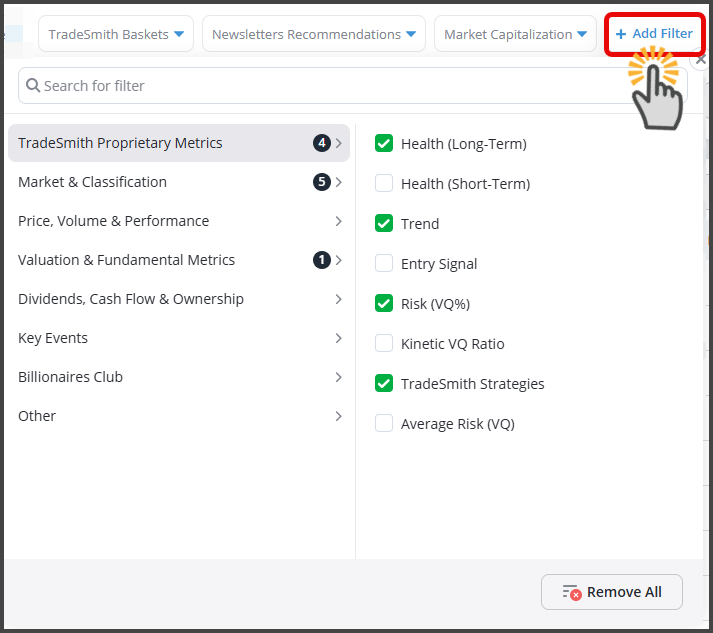
And if you’re looking for a certain data filter but you’re not sure where to find it, simply search for it with the “Search for filter” field.
To start fresh, simply select the Remove All button. Meanwhile, click the Clear Filters button to clear the selected criteria for each filter, keeping the filter itself displayed.
Ready, Set, Screen!
Let me walk you through an example to illustrate the power of our Screener.
Here’s how to set up the following screen…
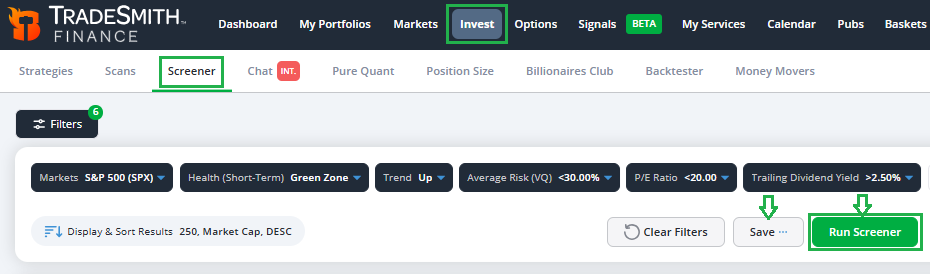
To find each filter, look under the following categories:
Market & Classification
- Click on Markets and select S&P 500 (SPX)
TradeSmith Proprietary Metrics
Click to choose three filters:
- Health (Short-Term): select Green Zone
- Trend: select Up
- Average Risk (VQ): set to Less than 30%
Under Valuation & Fundamental Metrics
- Click on P/E Ratio: set to Less than 20
And for Dividends, Cash Flow & Ownership
- Select Trailing Dividend Yield: set to More than 2.5%
Proprietary Filters Defined
I explained our TradeSmith Health indicator last week in our first “TradeSmith 101” column, if you happened to skip class that day.
Remember, even the best stocks can have a hard time performing in a volatile, unhealthy market.
That’s why it’s best to focus on healthy (Green or Yellow Zone) stocks that are in an uptrend, to boost your odds of a successful investment.
For this Screener, I’m focusing exclusively on the healthiest Green Zone stocks that are also in an Up Trend.
Average Risk is defined by our proprietary Volatility Quotient (VQ), the foundation of our system.
It measures a security’s normal volatility (or risk) based on its historical price behavior over time.
VQ isn’t static; it updates dynamically for every security we track based on new data and current market conditions.
Here’s how we measure risk with VQ:
- Up to 15% → Low Risk
- 15% – 30% → Medium Risk
- 30% – 50% → High Risk
- 50% and above → Sky-High Risk
Today’s markets are volatile enough without taking on added risk.
So, for this Screener, I’m targeting only low- or medium-risk stocks (< 30% VQ).
Right now, the S&P 500 Index trades at about 20 times earnings. So, for this screen I want to search for stocks with a P/E Ratio that’s at or below the index level (< 20 P/E).
As Rodney Dangerfield might say, Dividends get no respect these days… but I love dividends all the same.
That’s because you get paid cash income while you wait for your stocks to move up –what could be better?
But the average dividend yield for S&P 500 stocks today is just 1.2%. For this Screener, I’m searching for stocks with a Trailing Dividend Yield twice that of the S&P, or > 2.5%.
Once you’ve added all your Screener filters, click on Run Screener to view your results.
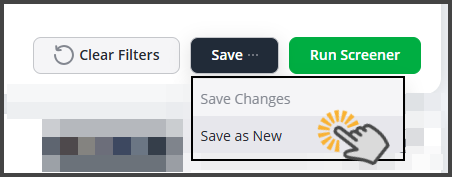
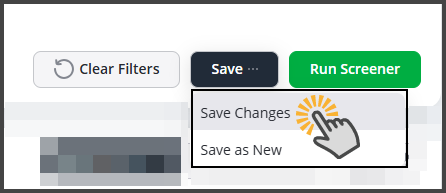
And if you like what you see, be sure to save your Screener filters to revisit later. Simply click the Save button and select “Save as New” from the drop-down menu:
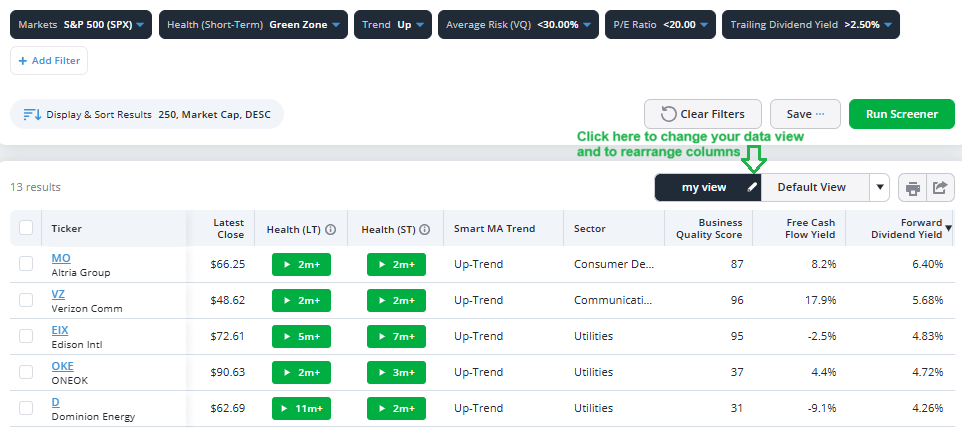
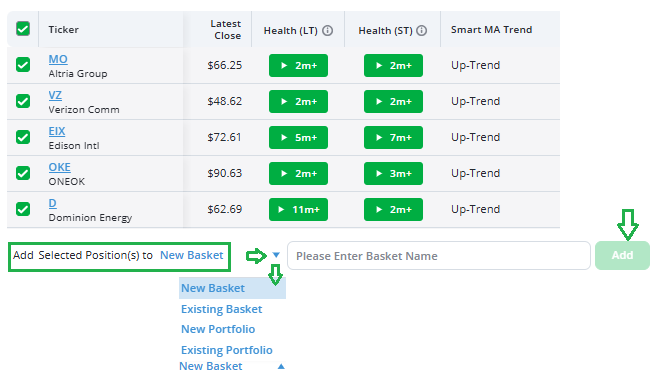
When I ran this Screener yesterday, I got 13 results. Here are the top five, sorted by the highest dividend yield…
Your Data, Delivered Your Way
When reviewing your results in the Screener tool, you can sort any column header alphabetically or numerically.
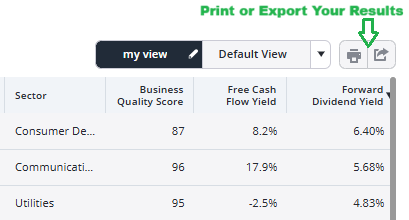
The beauty of this tool is that you can make it your own by adjusting the displayed column headers.
Adjust the data columns displayed by clicking on my view, to add or to rearrange the data that’s displayed.
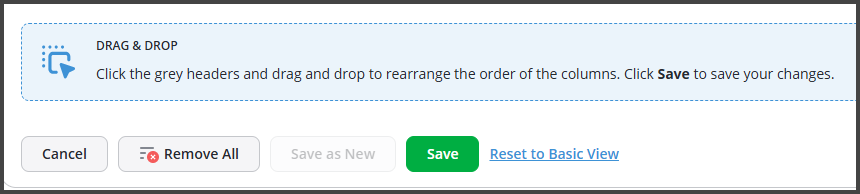
Rearrange the column headers by simply clicking and holding the column header with your left mouse key and dragging it left or right to your preferred spot on the page…
Alternatively, you can also edit the default view by clicking the white edit pencil in the active view. You can also create a new view by clicking the drop-down triangle and selecting the “Add View” link.
And don’t forget to hit the Save button if you make any changes.
Then simply click on the Select your pre-saved screener from the drop down box to select screeners you previously created:
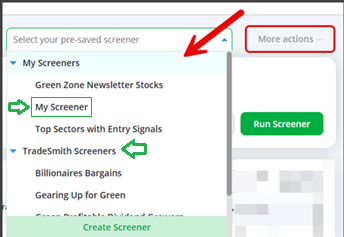
In this section, you’ll also find TradeSmith’spre-builtscreeners. There are dozens of preset screeners to explore, including Billionaire Bargains, Dividend Leaders, and Top S&P Stocks to Avoid.
You can load any pre-built screener and customize it by adjusting or adding filters. If you do make changes, be sure to click the “Save Changes” button to keep them:
More Fun with Screener Results
You can also take a deeper dive into your TradeSmith Screener results – with several convenient methods.
If you like your screener results and want to keep a watchful eye on these stocks, simply check the top box to select all tickers.
Then you can save them as a New Basket, add them to an Existing Basket, or add them to a New or Existing Portfolio or Watch List Portfolio as shown below:
If you prefer a tactile touch, you can print out your Screener data.
Or you can export the results to a spreadsheet, as shown below. This puts you in complete control of your data:
Mike Burnick’s Bottom Line: Use our cutting-edge Screener to find new potential buying opportunities, any time you’d like. It’s one of my go-to tools in any market climate, not only after a pullback.
I visit the Screener page every week, usually several times a week. I’m constantly searching for winning stocks that can give me a bigger edge as an investor. And you should take full advantage of our powerful Screener too.
Good investing,

Mike Burnick
Senior Analyst, TradeSmith
P.S. Everything we’ve covered is the result of more than 21 years of building, refining, and improving TradeSmith’s tools and technology. And we’re not slowing down. If there’s something investors need – we create it.
And right now, our team is working on what could be our next big breakthrough… powered by AI.
I can’t share much yet but imagine evaluating a trade before you place it – knowing its potential return, expected timeline, and historical success rate.
More clarity. More confidence. Stay tuned – we’re just getting started.