While Most Investors Worry About Market Swings, Jeff Clark Profits From Them
Today’s market moves fast, and in either direction.
I don’t need to rehash what we’ve all lived for the past three, six, 12, even 24 months. But it’s more important than ever to ensure that you’re managing your risk while also finding and seizing the best opportunities on the market.
… which is usually easier said than done.
But that’s why we’ve gathered the best and the brightest analysts here at TradeSmith – not the least of which being Jeff Clark.
Last month, I introduced you to Jeff Clark’s winning trading strategy. And today, I’ll show you exactly how he turns market chaos into consistent profits.
And stick with me here – because it uses a strategy that makes many traders’ skin crawl…
But I’ll show you exactly why it might be one to add to your trading repertoire.
How Jeff’s System Works
Jeff has been in the business for over 40 years, which has given him ample time to perfect his strategy. And best of all, it’s tailor-made to profit from today’s manic stock market.
You see, Jeff has a gift for spotting early signs of shifting trends in stocks and ETFs. And he aims to profit from these short-term moves using the leveraged potential of options.
You can find Jeff’s exclusive Convergence/Divergence source data on the TradeSmith Dashboard page, shown below.
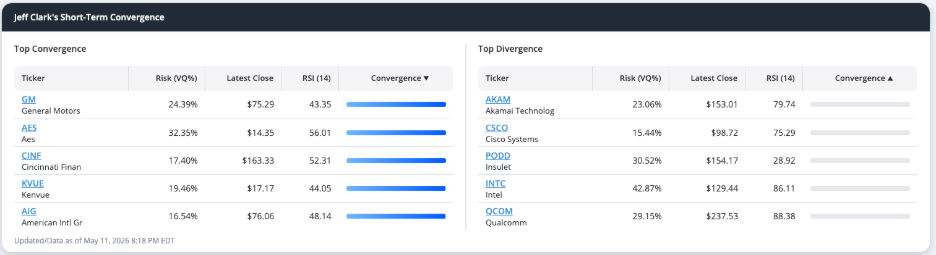
This data is ideal for identifying swing trades in volatile markets like the one we have right now.
- Top Divergence: Stocks whose price and momentum are pulling apart. In other words, the stocks have moved too far, too fast – either up or down.
- Top Convergence: Stocks whose price and momentum are coming back together. In other words, the stocks are returning to normal and they are poised for quick, snap-back reversals.But there is far more to Jeff’s strategy, and it’s a recipe for big gains in today’s extended stock market.
Jeff says today’s market is producing a rare “market disruption window”– similar to our TradeSmith “market melt-up” strategy.
That’s when certain stocks and sectors (and sometimes the entire market) go parabolic. Just like semiconductors have recently, up 50% in just over a month.
During these disruptions, stocks can gap up (or down) 10-20% or more from one day to the next.
We’ve experienced two disruption windows like this in the recent past: the 2023 mini-banking crisis, when regional banks were hit hard, and again last year during the AI repricing.
In both periods, Jeff produced winning streaks long enough that it could have turned a $5,000 stake into over a $1 million windfall by rolling from one trade to the next.
It’s all about finding the perfect trade. Here’s how Jeff does it…
How to Spot the Best Divergence Trades
It’s simple. Jeff’s trading system scans the market for stocks that have moved far from their key moving averages and are set up to snap back to them.
A moving average is a trend-following indicator that smooths out the price trend by displaying a constantly updated average price.
When a stock’s price moves too far away – either too high or too low – from where it historically trades, it tends to snap back to the base trendline.
Just like a stretched rubber band will eventually snap back.
And that gives you the chance to take relatively small stock moves and turn them into big options profits… as long as you’re willing to.
Now, spotting the opportunity is one thing. Timing is another.
But Jeff’s got you covered here, too.
Wait for Momentum to Confirm the Move
The key to Jeff’s trading success is waiting for just the right moment to pull the trigger on a trade.
He waits patiently until his trusty momentum indicators diverge from the price trend. These indicators show at a glance whether a trend is strong or weak, and if it’s likely to continue or reverse.
Here’s where I asked you to stick with me earlier: Jeff recommends options trades.
But as I said before, spotting the opportunity and timing it right greatly increases your chance of success – and Jeff can do both for his readers.
One way he does it is with those momentum indicators I mentioned above:
- If the momentum indicators flash a “negative divergence” with price, Jeff aims to profit using put options.
- And if these indicators signal a “positive divergence,” he goes for the chance at quick gains with call options.
Let me illustrate the power of Jeff’s Divergence strategy with two recent trade examples.
109% Gain in 6 Days on Overbought Bank Stocks
In January, bank stocks had just staged a big run higher over just a few months, with the Financial Select Sector Fund (XLF) up nearly 30%.
That move was a bit too far, too fast – leaving XLF stretched to the upside. The rubber band was about to snap back.
Sure enough, a negative divergence flashed as XLF’s price continued rising while the Moving Average Convergence Divergence (MACD) and the Relative Strength Index (RSI) declined. That divergence confirmed a reversal in momentum.
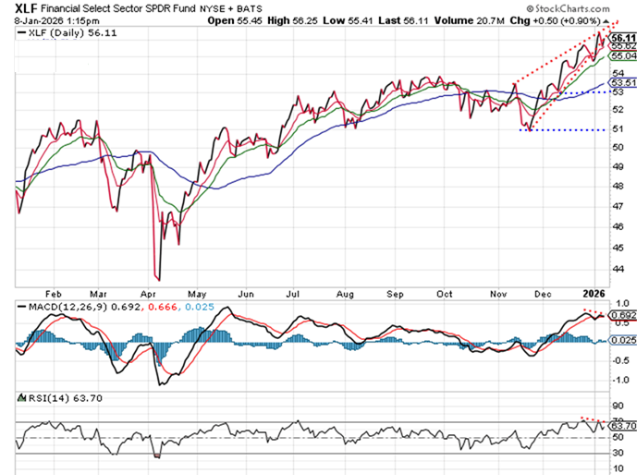
On January 9, just a few days after the peak, Jeff recommended buying XLF February put options. XLF reversed sharply lower, and the put options soared 109% in just six trading days!
140% Profits in 8 Days from an Oversold Health Stock
And in February, leading healthcare technology stock Oscar Health (OSCR) was down for the count.
The end of enhanced Affordable Care Act (ACA) benefits and increased regulations spooked investors, and the entire healthcare sector sold off sharply.
Shares of OSCR fell to nearly a one-year low, well below its moving average.
But price momentum indicators, including the MACD and RSI, were telling a more bullish story.
Both momentum indicators signaled a positive divergence with price.
On February 24, Jeff recommended his Delta Report members to buy OSCR April call options.
He nailed the low in the stock to the exact day. OSCR surged 22% higher in just eight trading days, and the call options soared 140%.
Two trades. Two completely different setups. And the same result: triple-digit gains in a matter of days.
Mike Burnick’s Bottom Line: Plenty of folks think options are the riskiest game in town. But when used the right way – combined with Jeff’s Convergence/Divergence trade strategy – options can actually lower your risk while amplifying the upside. Reducing risk doesn’t mean every trade will be a winner. But Jeff believes that when you trade with the reward/risk probabilities stacked in your favor, options can be far less risky that trading stocks outright.
Good investing,
Mike Burnick
Senior Analyst, TradeSmith
P.S. Now you know how Jeff’s Convergence/Divergence strategy works – and why it’s so well suited to the market we’re in right now.
But here’s the thing: Jeff believes a rare “market disruption window” is now underway. A period when certain stocks go parabolic and can produce extended winning streaks for traders.
In February 2025, the last time a disruption window opened, Jeff guided his readers through 12 trades over nine months – turning a $5,000 stake into more than $2.6 million.
And Jeff believes today’s market disruption window is setting up the same way.
That’s why this Thursday, May 14, at 10 a.m. ET, Jeff Clark will reveal his plan to take advantage of it. It’s called the 12 Trades to $1 Million Challenge – and you can reserve your seat completely free of charge.
Jeff has been trading for 42 years. He says he has never shared anything like this publicly before.
But registration closes in less than two days. Click here to reserve your spot before it’s gone.