Your Fifth “Lesson” in TradeSmith: How to Turn Your Dashboard Into a Daily Profit Engine
Editor’s Note: If you’ve been following along with our TradeSmith 101 series, you’ve already seen how powerful the right tools can be in today’s market.
Earlier this week, we pulled back the curtain on our Options360 suite, showing how traders can use advanced screeners, probability of profit (POP) metrics, and return on investment (ROI) projections to uncover high-probability opportunities every single day.
From income-focused put-selling strategies inspired by Warren Buffett… to covered calls and more sophisticated spread trades, it’s a system designed to stack the odds in your favor.
But Options360 is just one piece of the TradeSmith puzzle…
Great investing isn’t just about one strategy. It’s about having the flexibility to approach the market from multiple angles.
And that’s what I admire most about the hub for all of our tools, strategies, and newsletters, TradeSmith Finance.
For all its features, you can really slice TradeSmith Finance down into two sections – and it all depends on which type of trader you are……
- On one side, you have data analytics for “DIY” investors who want to roll up their sleeves and crunch the numbers themselves to find new opportunities.
- And on the other, you get actionable buy/sell ideas delivered by our expert analysts using TradeSmith’s proven data.
It’s a bit like ordering off the menu at your favorite Chinese restaurant. There is something that appeals to everyone’s tastes, and usually several things are worth trying.
In the same way, TradeSmith delivers something for every investor and trader alike. In fact, most long-time TradeSmith users enjoy mixing and matching: using our data to find self-directed trade ideas while also tapping into our analyst insights for real-time recommendations.
And the easiest way to take advantage of both strategies is by visiting your TradeSmith Dashboard page.
Let me show you exactly how to navigate it.
Your Command Center for Market Trends, Opportunities, and Risk Management
Simply log in to your TradeSmith Finance account and click on Dashboard on the top navigation bar.
Keep in mind, the Dashboard features available to you depends on your subscription, but to get full access, simply call us at 888-623-0858 to learn more.
At the top of the Dashboard, you’ll see the market dashboard with links for tracking market trends, your own investments, and more.
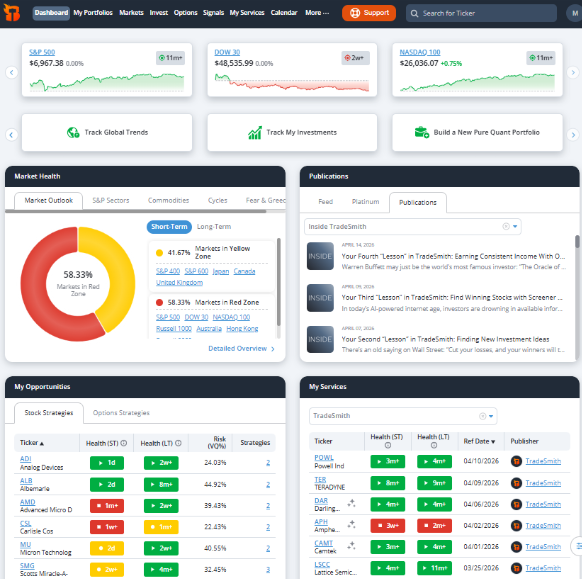
Just below that, you’ll find links to our familiar Market Heath indicators and Publications, so if you ever miss an email issue of Inside TradeSmith, you can easily find it here!
Also included is My Opportunities, with links to our proven stock and option strategies, and My Services.
Simply click on the left or right arrows to view additional data or click on any linked ticker symbol from any list for more details.
Scrolling further down the Dashboard page brings you to our all-important TradeStops section.
A Wall Street mentor of mine once said, “If you manage the downside, the upside takes care of itself.” And TradeStops is dedicated to that belief.
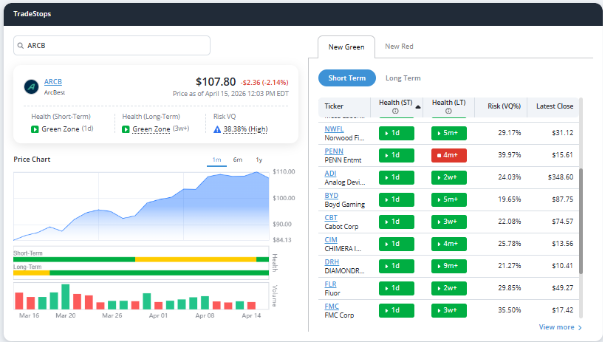
Here, you can see stocks that are just entering the short- or long-term Health green and red zones.
And if you’ve securely synced your portfolio with TradeSmith, then you should already have TradeStops alerts set for every investment you own.
Click on the View More link to see an expanded list of stocks with recent Health indicator changes.
Pro tip: I check this page frequently for stocks with new flash buy signals that show up on the New Green list, which I’ll then research further.
TradeSmith Signals for Every Strategy
Scrolling further down the Dashboard page brings you to sections of market data originated and used by our TradeSmith analysts to deliver specific trade ideas. This includes:
Jeff Clark’s Short-Term Convergence/Divergence
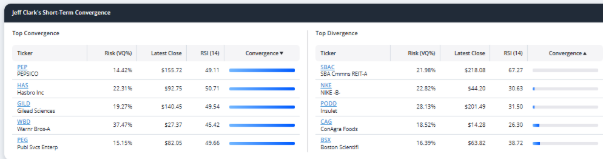
This data is ideal for swing traders. Top Convergence shows stock with a lot of energy building for a big move in one direction or the other.
Top Divergence stocks are trading extremely far away from various moving averages – either overbought or oversold – and may be poised for a sharp trend reversal.
Pro tip: Convergence/Divergence data is a great resource for short term stock traders or speculative option traders looking for big moves.
The next section you come to on the Dashboard page is…
Quantum Score
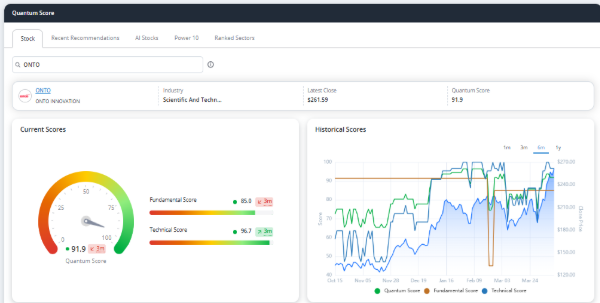
Developed by a team of TradeSmith senior analysts, Quantum Scores consider a combination of fundamental and technical indicators, plus the all-important Big Money flow indicator, for stocks and ETFs.
- Type any ticker to find its current Quantum Score
- Recent Recommendations are stocks with high Quantum scores
- View our AI Stock and Power 10 Stock lists
- And click on Ranked Sectors to view Quantum Scores by industry
The higher the Quantum Score, the better!
Pro tip: Quantum Scores are a valuable resource for long-term investors looking for stocks being propelled higher by strong institutional money flow.
Scroll further down the Dashboard page, and you’ll come to…
Predictive Alpha
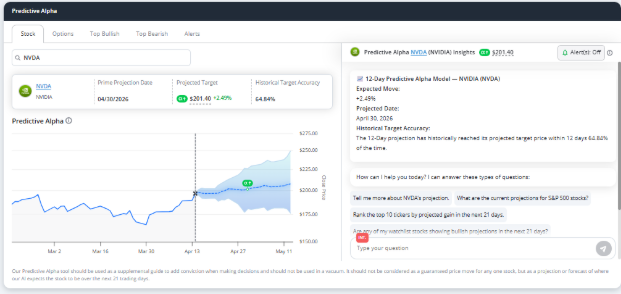
Predictive Alpha includes an entire suite of TradeSmith tools powered by our artificial intelligence-based algorithms.
This includes specific price projections for thousands of stocks and select ETFs for up to about one month out. Including expected target dates and target prices – right down to the penny – as projected by our Predictive Alpha system.
Plus, we offer dedicated Predictive Alpha stock and option portfolios with oversight by our analysts John Jagerson & Wade Hansen.
In the Predictive Alpha Dashboard, you can:
- Type any ticker symbol to search its projected price target, target date, and Historical Accuracy.
- View Top Bullish lists of stocks expected to move up and Top Bearish list of stocks expected to move down.
- Plus, you can easily set alerts to notify you when a stock reaches its Target Price or when the Target Date is reached.
As always, you can click on any of the highlighted stock links for more details on any Predictive Alpha stock or option ideas.
Pro tip: Predictive Alpha is an ideal resource for folks interested in short-term stock and options trades.
The next section on the page comes to…
Seasonality
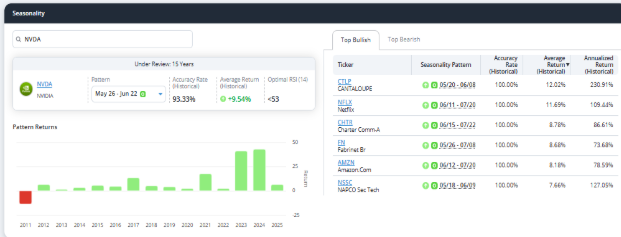
Our proprietary Trade Cycles analysis identifies recurring price patterns in the stock market and individual stocks. By leveraging historical price data, Trade Cycles highlights Seasonal trends and high-probability buy/sell opportunities throughout the calendar year.
Pro tip: Seasonality is a valuable resource for uncovering short-to-medium-term stock and ETF trade ideas with proven seasonal trends.
Keep moving down the Dashboard page and you’ll find…
Earnings Season Pass & Social Heat Score
Analysts Andy and Landon Swan deliver these unique data feeds to TradeSmith.
The Social Heat Score (below, lower panel) is your gateway to real-time consumer sentiment insights –covering products & services that consumers buy, talk about, and recommend to friends.
You can use it to search for any stock ticker and instantly view its bullish or bearish score, powered by real-time analysis of live social media trends.
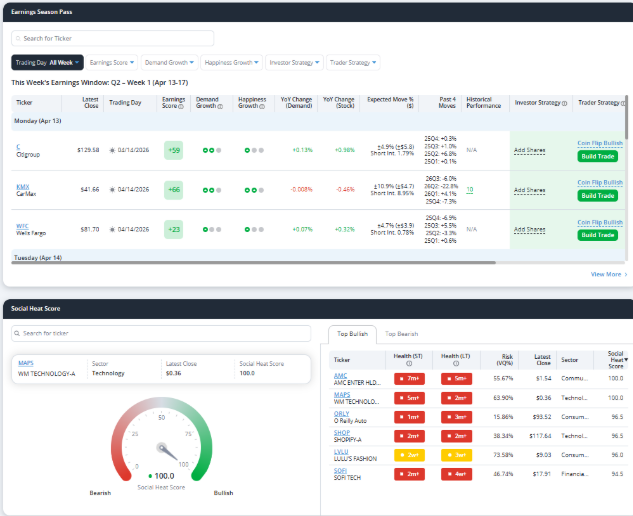
Earnings reports move stocks – and markets.
By harnessing the power of consumer insights, this data can predict when a stock’s results will meet, beat, or miss earnings forecasts.
Every week you’ll find valuable data on stocks likely to have positive or negative earnings surprises – including specific trade strategies – so you can aim to profit from the stock’s earnings move.
Scrolling down the Dashboard page a bit more, you’ll see our exclusive …
Model Portfolios
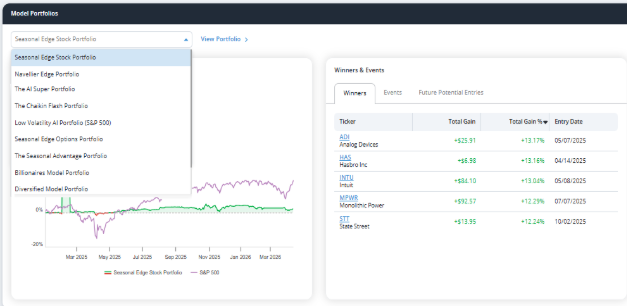
The Model Portfolio page contains a wealth of actionable trading and investment ideas, including:
- AI Super Portfolio
A five-stock rotating portfolio with bullish Predictive Alpha projections and high Target Accuracy rates.
- Low Volatility AI Portfolio
A five-stock rotating portfolio with large-cap market leaders in the S&P 500 according to Predictive Alpha data.
- Seasonal Edge Stock Portfolio
Selects bullish seasonal patterns for S&P 500 stocks and automatically delivers timely buy and sell alerts.
- Seasonal Advantage Portfolio
Identifies top five S&P 500 stocks with consistent seasonal strength, updated monthly.
- Seasonal Edge Options Portfolio
Similar to the seasonal stock strategy above but applied to call option trades for higher-risk, higher-reward trade opportunities.
- Billionaires Model Portfolio
Stocks owned by 40 of the world’s elite hedge-funds and billionaire investors, including Warren Buffett.
- Navellier Edge Portfolio
Based on Louis Navellier’s stock grades and our Seasonal Edge system to build a focused stock portfolio, updated quarterly.
- Chaikin Flash Portfolio
Combines the Chaikin Power Gauge Rating and TradeSmith Short-Term Health indicators to create a five-stock portfolio, updated monthly.
Simply select the portfolio(s) you want to explore and click View Portfolio to get more details on the open and closed positions for each portfolio.
Pro tip: The Model Portfolios page is a perfect destination to find new stock and option trading ideas you may want explore further. You can also find details for the Model Portfolios by clicking on the My Portfolios tab from the main menu, then click on Model Portfolios in the sub menu.
Remember, the Dashboard features available to you depend on your TradeSmith membership. So, if you don’t see all the features described above but want full access, simply call us at 888-623-0858.
Mike Burnick’s Bottom Line: TradeSmith delivers an exceptional lineup of timely data analytics and analyst-driven opportunities that appeal to every trader and investor. No matter what your experience or investment style, we can provide you with an endless source of new ideas to profit from. And the easiest way to tap into this wealth of ideas is by frequently visiting your Dashboard page.
Good investing,
Mike Burnick
Senior Analyst, TradeSmith
P.S. What I admire most about TradeSmith is that it meets investors exactly where they are – whether you prefer to dig into the data yourself or follow proven, analyst-driven ideas.
And as you’ve just seen, the Dashboard is the hub where all of that comes together… a place to track opportunities, monitor risk, and uncover new trades using a wide range of tools.
But here’s the reality…
In a market like 2026, even the best tools can struggle to keep up. We’ve seen sharp rotations and sudden reversals that can whipsaw even seasoned investors.
So what if you could go a level deeper – beyond charts, fundamentals, or even traditional AI?
That’s exactly what TradeSmith has been building. In short: a new way to detect the most profitable trades each day, 90 minutes before they occur, showing you which stocks still have real, true potential to rise, no matter what the market throws at us.
This year alone, using a backtested “boost” feature of our beta recommendations, you could have made:
- 1,082% in 33 days on Generac
- 461% in 13 days on HCA Healthcare
- 365% in 30 days on Lockheed Martin
Get ready for the AI Signals Trading Event, our most anticipated briefing of the year – and it’s all going live at 10 a.m. Eastern on Wednesday, April 22.
After 12 months of development, this new AI analyzes over 2,000 stocks and 2.09 million daily trade evaluations… building behavioral profiles designed to spot the trade setups that have historically led to big moves.