
Check Out Your Latest TradeSmith Finance Customization Features
Our software development team is always working overtime to enhance your user experience. In recent weeks, we’ve released several upgraded features to the TradeSmith Finance platform – and today, I’m proud to give you a guided tour of your coolest new features.
Moving forward, we’re giving you more ways to customize your top-level view of the assets you review on TradeSmith Finance, to make sure the data you use most often is front and center on your display.
Specifically, you now have the ability to modify the statistics fields displayed on the TradeSmith Finance Asset Details page. This new enhancement to the recently overhauled page allows you to tailor your view – and focus on the data that’s most important to you.
Be sure to read through to the end of this issue – starting today, Inside TradeSmith will now be your go-to location for news on the latest TradeSmith Bootcamp webinars, hosted by my colleague Marina Stroud, our Product Education Lead.
Let’s start today’s tour.
New Data Displays and Customizable Features!
To start customizing the Asset Details page to your liking, pull up any asset of your choice in TradeSmith Finance, whether it’s from the search bar or selected from one of your portfolios. For this example, I’ll be looking at Apple (AAPL).
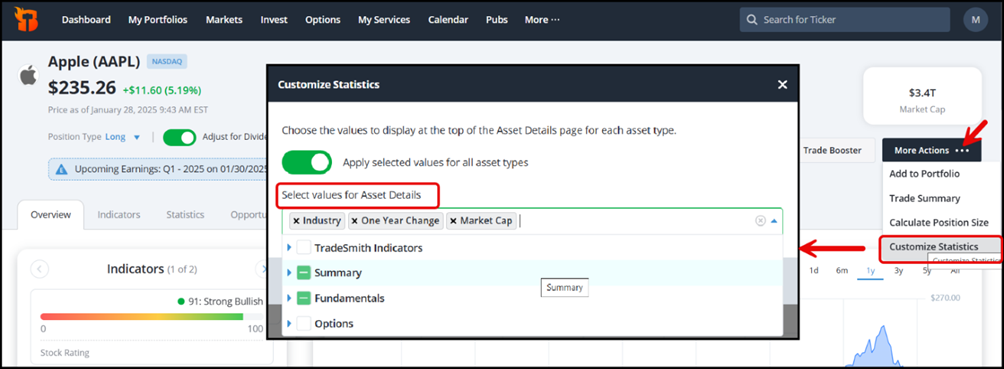
On the main Asset Details page, click on the box at upper right corner labeled More Actions, just below the adaptive header bubbles. From the list of actions that appears, navigate to Customize Statistics and click on that option.
From the window that appears, you can now use the dropdown menu to access dozens of different statistics to customize the details listed in the Asset page’s adaptive header:

As shown above, your options include all your favorite TradeSmith Indicators – with all of our most popular proprietary data calculations…
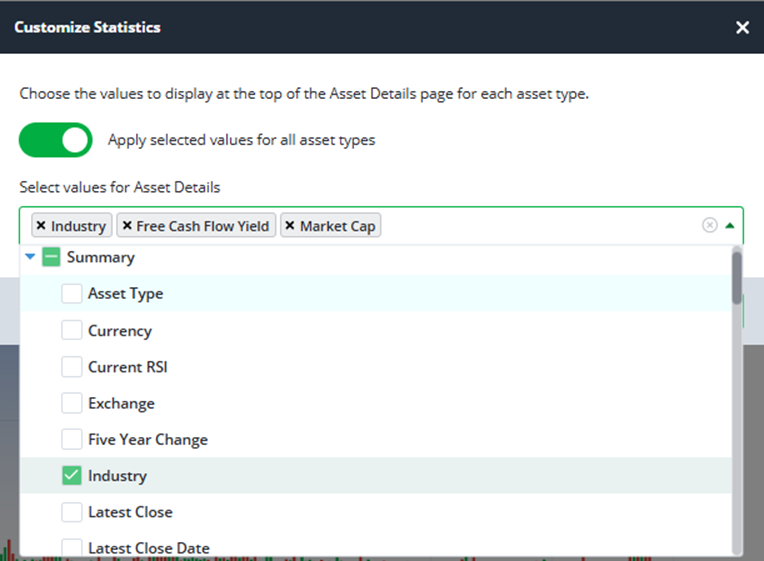
As well as Summary data, including basic details like Asset Type, Current RSI, Industry, and Latest Close…
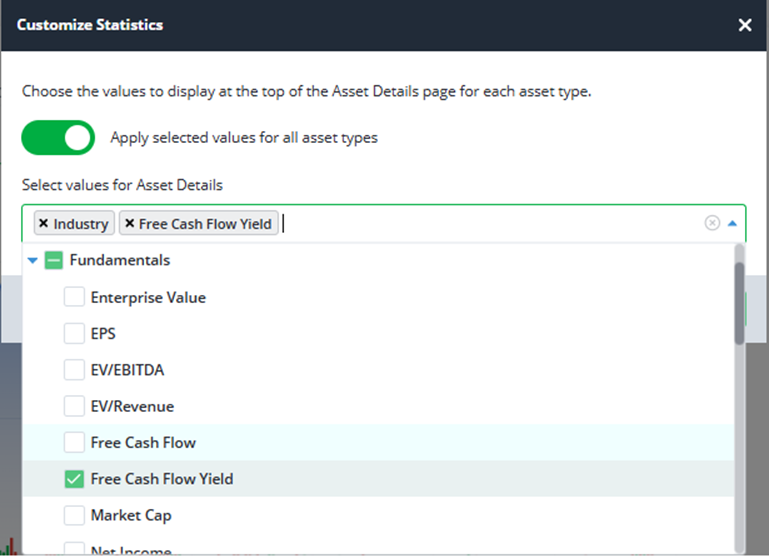
And Fundamental data metrics like my favorite Free Cash Flow Yield (FCF), earnings-per-share (EPS) values, Market Cap, and more.
There is also a category for options-specific data you can chose from.
Simply select your preferred values from these indicator categories, then click Save Changes to finish customizing your Asset Details page.
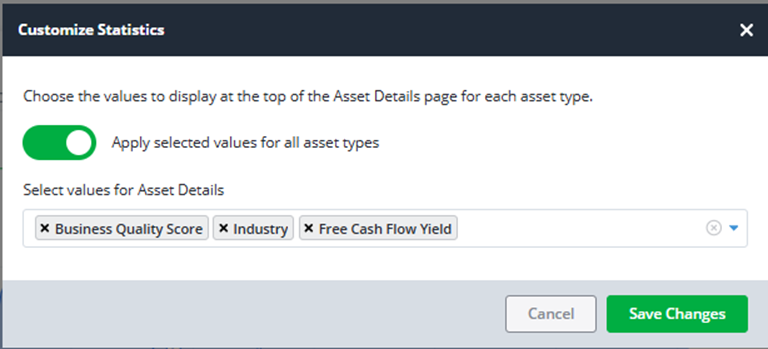
Your favorite data fields will now show up in the upper right corner of the Asset Details page for every stock you review. You can see my personal Asset Details view below – I added the Trade Cycles Turn Area data, our Business Quality Score (BQS), and Free Cash Flow Yield:
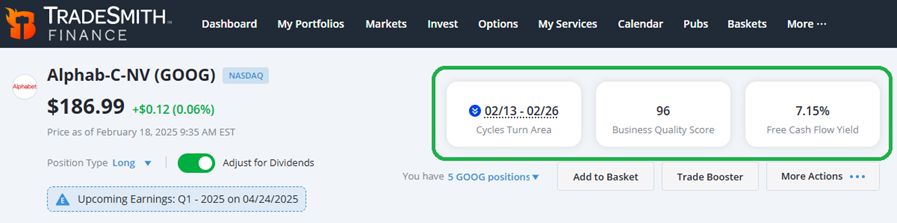
So, at a glance, I know that GOOG is in a Valley turn cycle, has an outstanding BQS of 96 out of 100, and a high Free Cash Flow yield of 7.15%!
You aren’t limited to just three options in this header, either: if you select additional values, you can use arrows that will appear on either side of the bubbles – allowing you to quickly skim through any number of details on each asset you review.
Your Updated Fear & Greed Indicator
But that’s not all that’s new on TradeSmith Finance: Our developers have also enhanced the Fear & Greed indicator. Specifically, we’ve added several new chart settings and data comparison fields for you to review.
As a note, the Fear & Greed tool is available to Ideas by TradeSmith, Trade360, and TradeSmith Platinum members. If you don’t have access to it in your TradeSmith Finance platform – and would like to – simply call us at 888-623-0858.
To access the Fear & Greed tool, click on the Markets tab from the main menu bar. Click on Fear & Greed at the upper left, then select the Fear & Greed Over Time tab to see a historical display of this valuable sentiment indicator:
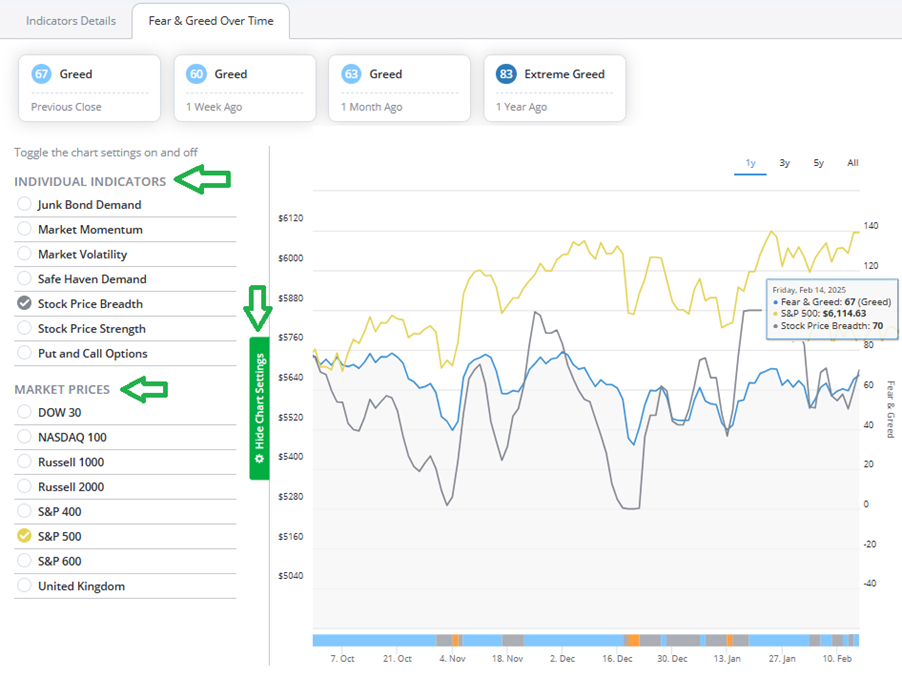
By selecting the green Show Chart Settings label at the far-left margin, you can review a selection of additional indicators and market prices you can select to compare with the Fear & Greed values.
In the screenshot shown above, I selected Stock Price Breadth and compared it to S&P 500 Market Prices. Once you’ve made your selections, click on the green Hide Chart Settings label to return to full screen view.
Now you can hover over any date on the Fear & Greed chart, and a data box will appear showing you all the indicator values for that date – for any timeframe you select.
And speaking of timeframes — I’ve written plenty about our all-new Seasonal Edge portfolio, based on our popular Trade Cycles Seasonality tools. And while we only launched the system a month ago, our developers have already added several key enhancements to bring you more information on potential seasonal buying opportunities for stocks.
Recent Updates to Seasonal Edge: Calendars, Optimal Values, & More
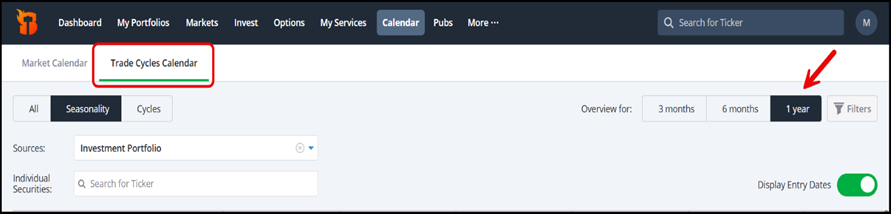
First, our programmers have added a new one-year setting to the Trade Cycles Calendar, allowing you to view and plan your seasonal trading opportunities over an even longer timeframe for improved strategy management — across a full calendar year: Simply click on the Calendar tab and select the Trade Cycles Calendar option, as shown below.
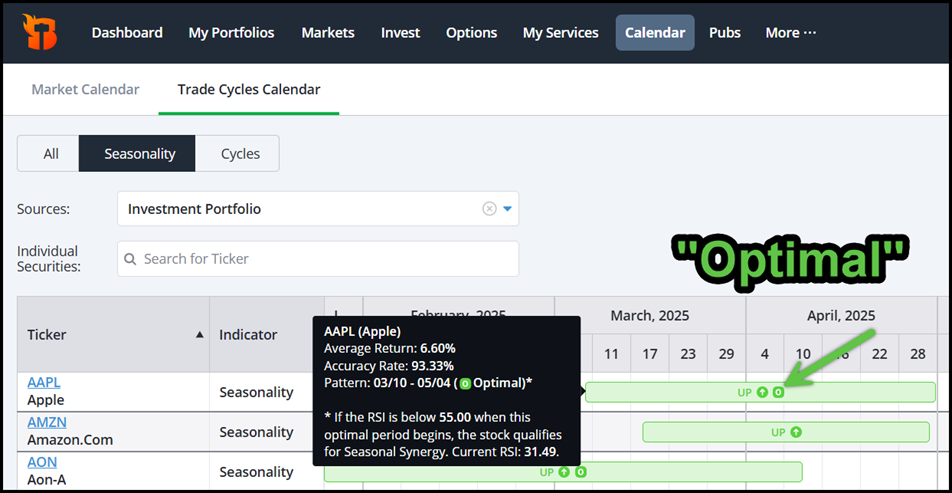
We’ve also added the detailed optimal Relative Strength Index (RSI) values for stocks with optimal seasonal patterns to the Seasonality Calendar:
Note: The Trade Cycles Calendar is only available to subscribers to Trade Cycles by TradeSmith and members with TradeSmith Platinum accounts.
At a glance, this new update to the Seasonality Calendar gives you more detailed insight into the upcoming seasonal windows opening for your stocks – to help you determine whether current conditions are lining up with the historical patterns.
In the screenshot above, we’ve identified an Optimal seasonal pattern for Apple. It starts March 10 and ends May 4, and has a 93.33% accuracy rate – with an average return of 6.6% during this period.
As part of this new update, we also display the stock’s current RSI reading, which for AAPL is 31.49 right now. If AAPL stock has an RSI reading below 55 on March 10, when the optimal period starts, the stock qualifies as a Seasonal Synergy trade.
Seasonal Synergy signals flash when all of our seasonal indicators are aligned – making the chances for a probable winning trade that much higher. The Seasonal Synergy signals, plus all the optimal patterns and RSI data needed to trigger a trade, are also displayed on a stock’s Asset Details page. You can access them by clicking on the Trade Cycles tab.
Your Next TradeSmith Bootcamp: Getting Started with Trade Cycles
On the topic of Trade Cycles and Seasonal Edge, this Thursday, Feb. 20, your latest TradeSmith Bootcamp Webinar will be all about our powerful seasonality product – and the powerful market timing program at the heart of it, designed to help you better time your market decisions with confidence.
In this session, starting at 1:00 p.m. Eastern Time, join Product Education Lead, Marina Stroud, for an exploration into how our Trade Cycles indicators can help anticipate market turns and uncover key periods when stocks historically show upward momentum.
She’ll take you on a guided tour of the TradeSmith Finance platform, highlighting the Trade Cycles features, tools, and resources that can enhance your ability to implement cycle-based analysis – and will wrap up with a live Q&A section.
You can click HERE to register for Thursday’s webinar.
Mike Burnick’s Bottom Line: Our amazing development team is always working on new features, strategies, and data displays. Be sure to take a closer look at the new features shown above. And stay tuned for much more to come soon.
Good investing,
Mike Burnick
Senior Analyst, TradeSmith
P.S. There are plenty of new developments happening on TradeSmith Finance, as our development team works hard to improve your user experience – but that’s not the only space where technology is moving… and moving quickly.
The latest generation of artificial intelligence has advanced at a rapid pace since ChatGPT hit the market in November 2022 – it’s evolved from useful chatbot responses to systems that can perform research, create realistic video, and speak over the phone. Recently, the DeepSeek AI model out of China has challenged American AI dominance – and Trump 2.0’s announcement of the Stargate AI initiative has made it clear that keeping that dominance is a strong policy goal.
But AI isn’t just a hot market trend… it’s an opportunity. And Wall Street legend Louis Navellier, my colleague at InvestorPlace, believes that we’re rapidly approaching the peak of that opportunity: a $100-trillion crossover moment, where AI becomes a far larger part of our world – and of the global economy.
Last week, Louis held the AI Crossover Summit – a special presentation where he revealed the results of his latest research into the AI space and discussed the future of the technology. He also shared insights on the under-the-radar AI stocks he believes are primed to benefit from the upcoming crossover moment… as well as his strategy on how to profit from them.
Louis’s moment is coming up soon – and you’re running out of time to check out his presentation. Click HERE to watch the AI Crossover Summit yourself – and get ahead of this life-changing advancement in tech before it’s too late.