Finding Opportunity in the Pullback: How to Spot Oversold Stocks with Upside Catalysts
The S&P 500 Index has dropped 7% from its January highs as the market’s wild ride continues.
But when you drill down to the sector level, opportunities in oversold industry groups are beginning to appear.
Combine oversold market conditions with bullish seasonality, and you can uncover profit potential during this market pullback.
Let’s take a closer look at what our TradeSmith indicators are showing us right now.
Sector Health: Where the Weakness (and Opportunity) Lies
Below is a screenshot of the TradeSmith Sectors page from yesterday. You can easily find this by clicking on Markets in the main menu.
That takes you to the main Market Outlook page – then simply click on S&P Sectors from the sub menu.

According to our short-term (ST) Health Indicator, three of the S&P 500 sectors have entered the Red Zone: Technology (XLK), Consumer Cyclical (XLY), and Financial Services (XLF).
In the next column, our long-term (LT) Health indicator shows two sectors have fallen into the (LT) Health Red Zone: Consumer Defensives (XLP) and Financials (XLF).
That makes Financials the only “double-red” sector – which means double trouble. Further downside is possible for financial stocks.
Most other sectors are a mix of green and yellow.
Healthcare is the only sector currently in the Yellow Zone for both the Long- and Short-Term Health Indicators. This means caution … but caution can also spell opportunity…
Here’s how to turn that cautionary signal into a potential trade.
TradeSmith Indicator Opportunities
Last week, I showed you how our TradeStops can help protect your wealth by combining our proven risk management tools: Health and VQ.
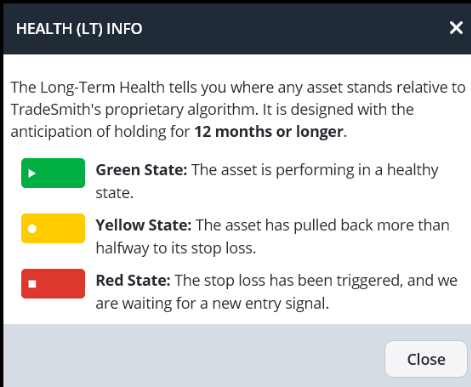
Recall that the Yellow Health state means an asset has pulled back more than halfway to its stop loss.
But you can think about this as the glass being half full, rather than half empty.
A sector or stock in the yellow zone has less room to fall – so the risk is also reduced. Often, stocks will enter the Yellow Zone, bounce around, then start trending up again.
That’s why it pays to monitor changes in ST Health for sectors and stocks you’re watching. When it turns green again, that’s a flash buy signal you can act on.
Taking a Closer Look at Healthcare
To dig a bit deeper into the Healthcare Sector (XLV), simply click on the highlighted ticker from the Sector list, shown in the first chart above. This will show you more details about the current health and trend distribution for XLV.
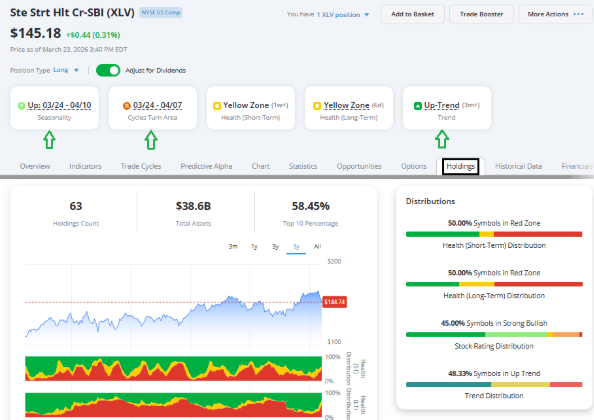
Next, click on Healthcare (XLV) once again to navigate to the Holdings page as shown above.
Here, you’ll find even more detailed data. Three things jump out at me right away (marked by the green arrows above):
First, our TradeSmith Seasonality indicators show a bullish window for XLV from March 24 to April 10.
Historically, XLV has moved up 86.7% of the time during this period, with an average return of 3.2%.
That may not sound like a lot – but if you invested only during this period over the past 15 years, you’d earn 69.5% annualized gains!
Second, this seasonal strength in XLV is confirmed by our TradeCycles indicators, which shows a cyclical upturn from March 24 to April 7 – nicely overlapping with the historically bullish seasonal pattern.
Third, although XLV is currently in the Health Yellow zone, our Trend indicator confirms it remains in a bullish uptrend.
Technical Support: XLV
Now, let’s take a closer look at the price chart for XLV by clicking on the Chart tab.
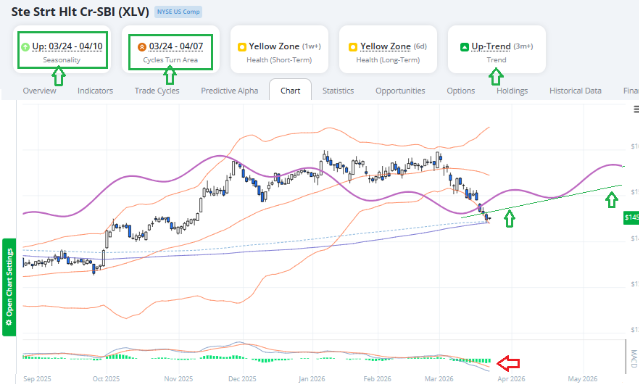
In the chart above, I added the Bollinger Bands (BB) indicator, which can help identify if an asset is overbought or oversold.
Bollinger Bands shows that XLV recently became extremely oversold – trading three standard deviations below its 50-day moving average.
Just below the current price of XLV sits the long-term 200-day moving average (solid line), a key support level.
And lining up perfectly with it is our own TradeSmith Smart Moving Average (dotted line), our customized measure of the long-term uptrend.
Taken together, these technical indicators tell me that XLV is:
- Extremely oversold, and overdue for a bounce…
- And sitting at strong long-term uptrend support.
This is the definition of a potential low-risk, high reward trade setup.
You could consider buying XLV here, with a stop placed just below the TradeSmith Smart Moving Average near $144.
An even lower risk approach may be to wait for XLV to trigger a new flash buy signal by moving back into the (ST) Health Green Zone.
Or if you prefer to take an individual stock approach to your investing, you can easily sort the list of XLV holdings by (ST) Health, as shown below:
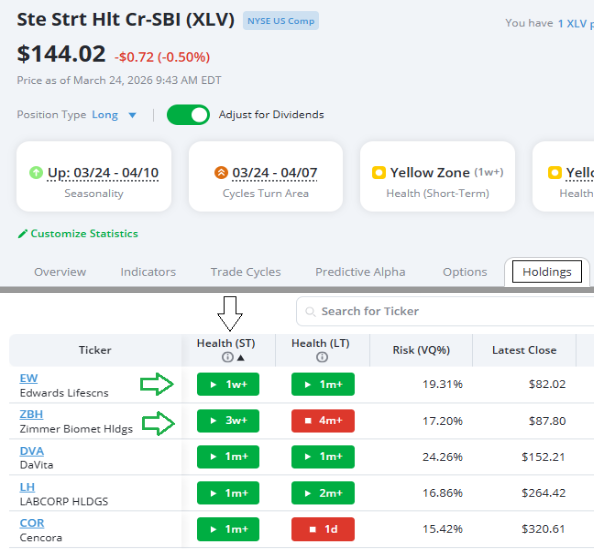
Simply click on the column Health (ST) from the list of XLV holdings to find stocks that recently triggered flash buy signals by entering the (ST) green zone.
For example, Edwards Lifesciences (EW) and Zimmer Biomet (ZBH) both registered flash buy signals in the past few weeks, despite recent market weakness.
That’s a bullish sign that these stocks can buck the stock market’s overall downtrend.
Several other healthcare stocks within XLV have also triggered flash buy signals over the past month. This is a great starting point for further research into these stocks as potential buy-the-dip candidates in the oversold healthcare sector.
Mike Burnick’s Bottom Line: You can harness the predictive power of our TradeSmith Charts – especially the Smart Moving Average – together with our Health, Seasonality, and TradeCycles indicators to find oversold assets trading near long-term support, with catalysts (seasonality & cycles) in place for a potential move higher.
Good investing,
Mike Burnick
Senior Analyst, TradeSmith
P.S. As you can see, even in a choppy, pullback-driven market, there are still pockets of opportunity – especially when you combine technical signals and seasonality.
But markets like this also tend to reward a more active, tactical approach.
Oversold bounces, short-term momentum shifts, and fast-moving setups can create opportunities that don’t last long… and require a different strategy than traditional buy-and-hold investing.
That’s exactly where my colleague Jeff Clark, editor of Delta Report, has been thriving.
Jeff specializes in identifying these short-term, high probability trades – the kind that can play out in days, not months. And this year, he’s been on fire… with readers capturing outsized gains in remarkably short periods of time.
Right now, he believes we’re approaching a critical turning point in the market – one that could bring heightened volatility, but also significant opportunity for investors.
Click here to get in on his next – and possibly biggest – trade recommendation of the year.