Watch Out for Risks – And Stay Alert For New Opportunities With TradeStops
The stock market has been on a wild ride lately. That’s no surprise, considering the growing list of worries facing both Wall Street and Main Street these days.
Stocks started to falter late last year as the “Magnificent 7” mega-caps – and the Technology sector in general – stalled out after years of strong growth and rising valuations. Those same stocks are now dragging down the broader S&P 500 Index, even as other sectors recover.
Meanwhile, consumers and smaller businesses alike have been squeezed by rising prices, as well as fears that Artificial Intelligence could eliminate not just a large number of jobs, but entire industries. That’s reflecting in economic reports – which have left investors even more anxious.
Then to top it all off, Wall Street received a warning from the head of America’s largest bank. Jamie Dimon, CEO of JPMorgan Chase, spoke recently about “cockroaches” crawling around credit markets.
And now the conflict with Iran has sent investors scrambling… and energy markets reeling.
Crude oil spiked above $120 last week. That’s double the price at the beginning of 2026:
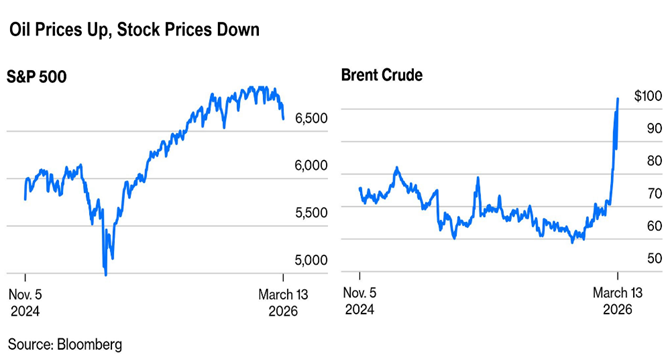
Higher crude prices mean higher prices for everything oil-related – from gas for the family car to the diesel fuel that keeps freight trucks moving across the country.
These higher fuel prices will likely raise shipping costs… and that’s without bringing up the possibility of soaring jet fuel costs, which could ground air travel and transportation.
If sustained, this would all eventually lead to higher inflation – which means we would likely see interest rates stay higher for longer. And that scenario could make investors even more nervous about their future prospects… which could send stocks even lower as a result.
In a climate of chaos and uncertainty like today’s, guarding against downside risks has never been a more important part of managing your portfolio.
And that’s where TradeStops comes in.
TradeStops by TradeSmith is our flagship risk management software: It’s a foundational part of our efforts to assist and enhance the lives of investors like you… and when it comes to protecting your wealth, it’s a crucial component of any plan I’d ever make!
In today’s issue of Inside TradeSmith, we’ll take a closer look at TradeStops and discuss how you can use it to stay alert for any risks to your portfolio.
Get Ready To Reduce Risk With A Quick Portfolio Sync
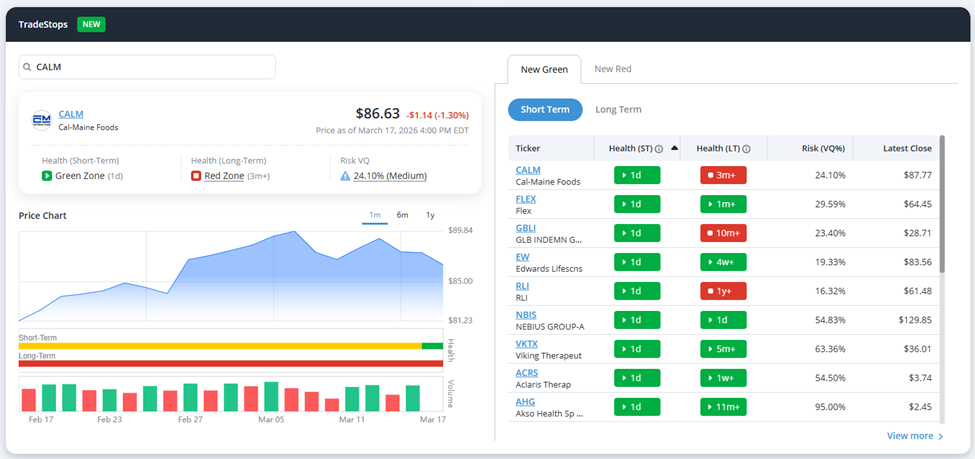
Members with access to our TradeStops tools can review health and risk analytics for any stock in our database on the TradeSmith Finance platform. And we’ve made that even easier with the new TradeStops widget, right on the TradeSmith Finance Dashboard:
NOTE: If you don’t currently have access to our portfolio management tools in your TradeSmith Finance platform – and would like to – call 888-623-0858 to discuss how to add them.
However, you can get the most out of TradeStops by syncing your brokerage account with TradeSmith Finance – allowing you to easily track all of your investments, and all of their analytics, in one convenient place.
If you haven’t done so already, you can safely and securely sync your investment portfolio to keep track of the health and performance of every security you own using our flagship TradeStops tool, all with a few clicks.
It’s a quick and effective way to take more control over your finances, and it helps you avoid unnecessary risks.
I covered our Portfolio Syncing tool in detail in a previous issue of Inside TradeSmith. It’s a great how-to resource you can follow step-by-step to easily and safely sync your brokerage account with TradeSmith.
Once your portfolio is in sync, you can fully capitalize on the features of our TradeStops tools, to help keep track of your investments and better manage risk.
Stay Alert In Volatile Markets With TradeStops
TradeStops is based on our unique risk metric, the Volatility Quotient (VQ). It’s the heart of our system, providing custom trailing stops for each security you own – and every stock in our database.
Plus, it helps guide you to the right position size based on each security’s own unique risk profile.
We use three years of historical price data to identify VQ, which is the “normal” volatility profile of each security. VQ is dynamically updated every week based on new market data.
Think of VQ as a guide that tells us how much a security typically moves up or down. Using historical price data, we calculate the normal movement for any asset.
The result of these calculations are our VQ Trailing Stops, which provide a customized protective stop level for every security you hold in your portfolio. And these trailing stops are constantly updated alongside the VQ of a security, allowing it to adapt as market conditions change.
These VQ calculations are also a key component of the TradeSmith Health Indicator…
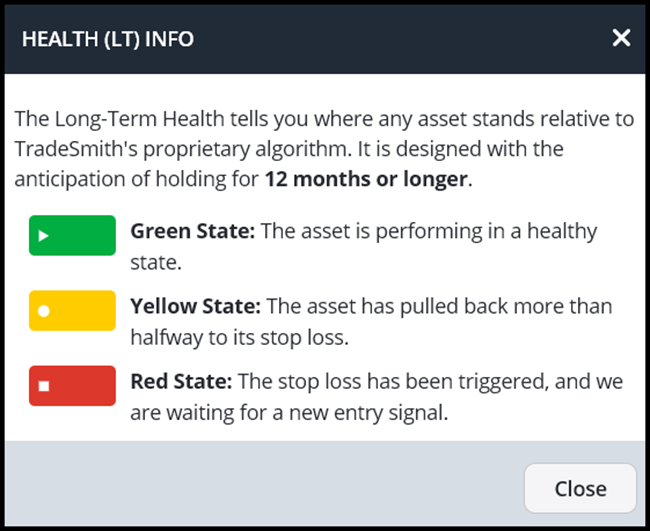
And by combining VQ trailing stops with signals from our TradeSmith Health Indicator, you end up with an easy-to-follow, momentum-based Buy/Hold/Sell strategy:
- When a stock is in the Green Zone, it’s a Buy: The price is moving within its normal VQ range…
- When a stock is in the Yellow Zone, it’s time to exercise caution and Hold…
- And when a stock is in the Red Zone, it’s time to Sell: The price has dropped by more than its normal VQ range, signaling significant weakness.
And though this sounds simple, it’s not a “one size fits all” solution.
Our VQ Trailing Stops are individually tailored to the unique volatility profile of each and every security in our database – taking a lot of the guesswork out of managing your investments.
Just take a look at TradeStops in action.
The tech sector has been hit hard by the recent market weakness. Below is a list of Holdings in the SPDR Technology Sector ETF (ticker XLK):
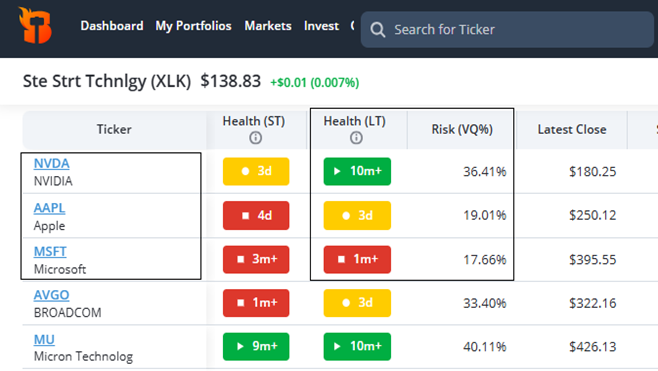
Just look at the top three stocks in the index – Nvidia (NVDA), Apple (AAPL, and Microsoft (MSFT).
These three stocks are all large cap technology giants. All established companies. But all of them have different risk profiles as measured by VQ.
As a result, NVDA is in the Long-Term (LT) Health Indicator Green Zone, marking it as a buy. AAPL is in the Long-Term Yellow Zone, calling for caution, and Microsoft is in the Long-Term Red Zone – triggering a sell alert based on its VQ Trailing Stop.
Three similar stocks, but three very different health assessments.
With TradeStops, you can quickly set protective VQ Trailing Stops and Alerts on every security in your portfolio. This helps your maximize gains by taking the emotions out of the investment process.
You’ll also receive TradeSmith Alert Report emails whenever any security in your portfolio triggers a Green, Yellow, or Red zone alert, as shown below:
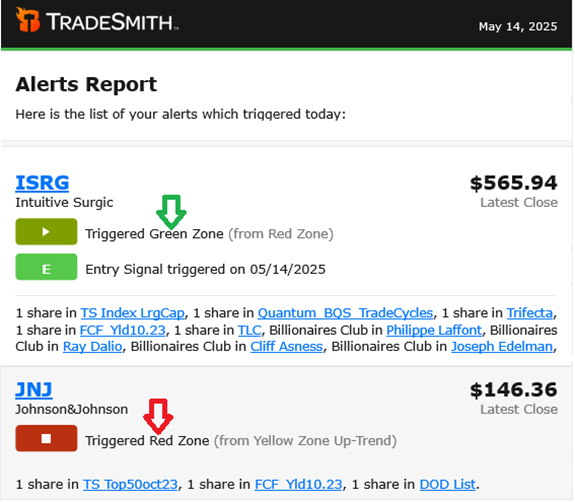
The Alerts Report will immediately warn you if a security you hold hits its TradeStops level. Plus, the Alerts Reports are a great source of new trade ideas.
Consider buying stocks with new Green Zone buy signals – but be wary of stocks that have entered the Yellow Zone!
Bottom Line: If you haven’t done so already, you should securely sync your broker account with TradeSmith. Then you can automatically set TradeStops alerts, making sure that you’ll never miss an important change to your investments. This can help you be a more successful investor by helping you manage risk effectively – and by protecting you from unexpected market declines before it’s too late.
Good investing,
Mike Burnick
Senior Analyst, TradeSmith
P.S. TradeStops is the foundation of TradeSmith’s risk management software – and as the market is rocked by oil shocks, rising volatility, and low investor confidence, it’s that much more important to use it and every other tool at your disposal to minimize risk.
That’s why I’m paying close attention to Eric Fry, Senior Analyst at our corporate partner InvestorPlace.
Eric has spent decades studying the market and its shifts – and through his research, he called both the mid-2000s Housing Bubble and the 2020 COVID crashes, well before they sent markets spiraling.
Recently, Eric has been keeping a close eye on the AI boom… and as the Technology sector has stalled out, he’s become increasingly concerned that we’re on the edge of a regime change… one that could create a whole new order of market winners and losers, on the level of the 2000 dot-com bubble.
And that shift – that market shock – could begin as early as next month, on April 24, 2026.
To get the word out ahead of this turn in the markets, Eric is going live TOMORROW, March 18, at 1 p.m. Eastern as part of his FutureProof 2026 event. During the event, Eric go into detail about the next phase of the AI boom… and share his advice on how to prepare and profit from the shock to come.
Click HERE to sign up for Eric’s event. You won’t want to miss it – and the clock is ticking…