Get All The Details With Our Upgraded Options360 Screener!
In recent issues, I’ve brought you up to speed with some of the latest enhancements to TradeSmith’s Options360 platform.
In case you missed it, you can catch up on those updates here and here.
The new Options360 Dashboard provides a wealth of actionable trading ideas selected by our powerful algorithms and vetted by our analyst team (led by yours truly), which you’ll find in the Opportunities area of the dashboard.
Just select Options360 from the main menu of your TradeSmith Finance platform and scroll down to review the latest trade ideas as they arrive from our system.
With new trades arriving each day, there’s plenty to choose from. But you can also tap into our database of market analysis to uncover your own option trade ideas by using a wide range of search filters you select yourself.
That’s because the upgrades to our powerful suite of options trading tools also include new updates to my own personal favorite of the bunch – the Options Screener.
So, as we continue our tour of Options360 updates, let’s spend today’s issue taking a closer look at the enhanced filters and functionality of the Options360 Options Screener.
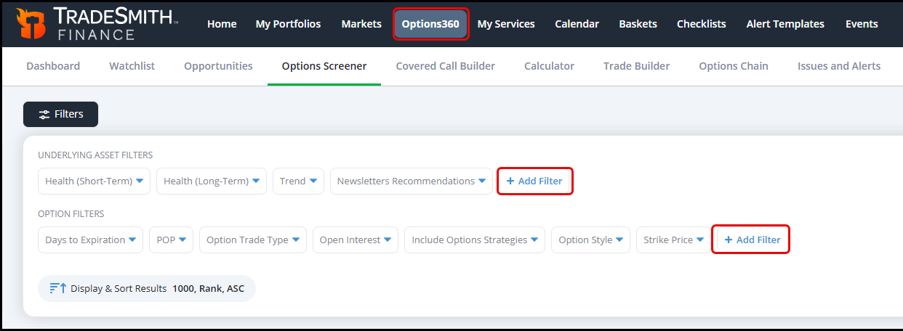
To access the Options Screener, subscribers to Options360 and TradeSmith Platinum can click on Options360 from the main menu of TradeSmith Finance, then select the Options Screener tab from the sub menu, as shown below:
(Please Note: If you don’t see this – and would like to – simply contact our Customer Care team at 888-623-0858 to learn more… or stay tuned for more details in the coming weeks!)
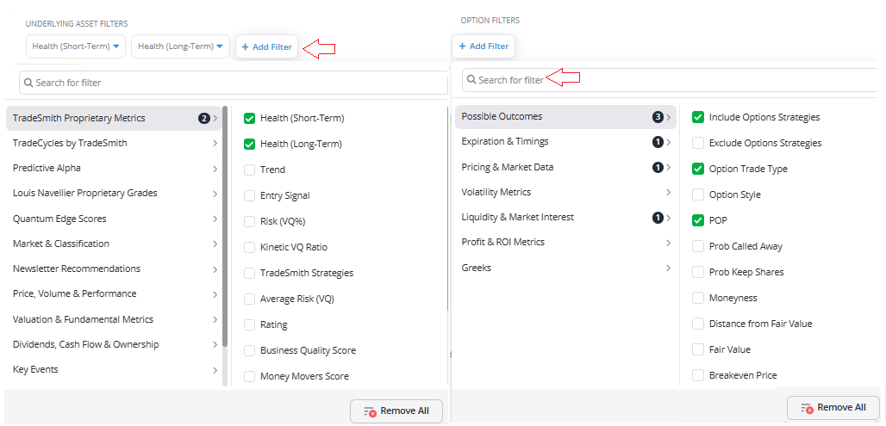
From this page, you’ll see some of the most popular underlying asset and option filters already preset at the top. But you can fully customize this page as you see fit. To add screener filters, simply click the blue +Add Filter buttons.
There are many underlying and option-related filters you can choose from to tailor your search however you’d like. But if you can’t easily find a filter you want to use, simply search for it in the “Search for Filter” box marked below.
Let me show you how to make the most of our Options Screener with an example – in this case, we’ll lean into bullishness and evaluate a Buy Call option trade.
To get started, I chose a few simple Option Filters to set up my screener:
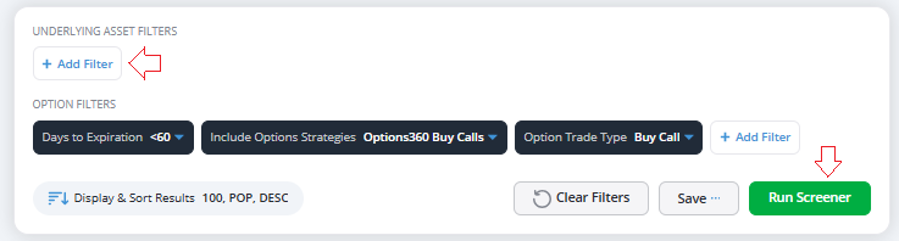
To make sure we’re just looking at call options trades, I set the following filters…
- Include Options Strategies, selecting Options360 Buy Calls,
- And Option Trade Type, set to Buy Call.
And then, to give this trade ample opportunity to work out…
- I include the Days to Expiration filter, set to less than 60 days.
Options lose a little bit of value every trading day leading to expiration day. So, as a buyer of call options, you’ve got time working against you. That’s why I screen for short-term trades expiring in 60 days or less.
I select Options360 Buy Calls from the list of Options Strategies because I want these potential trades checked by our algorithms first. That way, I know that any result we get will be a liquid option with a low bid-to-ask spread, high volume, and good amounts of open interest.
As an alternative, you could exclude the Include Options Strategies filter and just stick with the the Option Trade Type filter shown above – keeping the filter set to find Buy Call trades.
This may give you a wider universe of possible call option trades. But these trades would not be checked against our system, which is why I prefer sticking with Options360 Strategies.
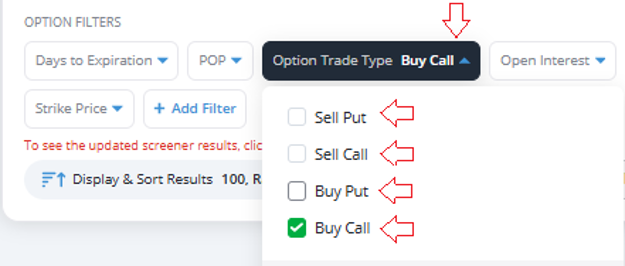
You can follow these same basic steps to screen for any other option trade type you prefer, by simply clicking on the Option Trade Type filter shown above and selecting the type of option you want from the list.
Once you have all your filters set, simply click the green Run Screener button to view your results. When I ran this Buy Call screen earlier this week I got over 50 results, with a sample shown below…
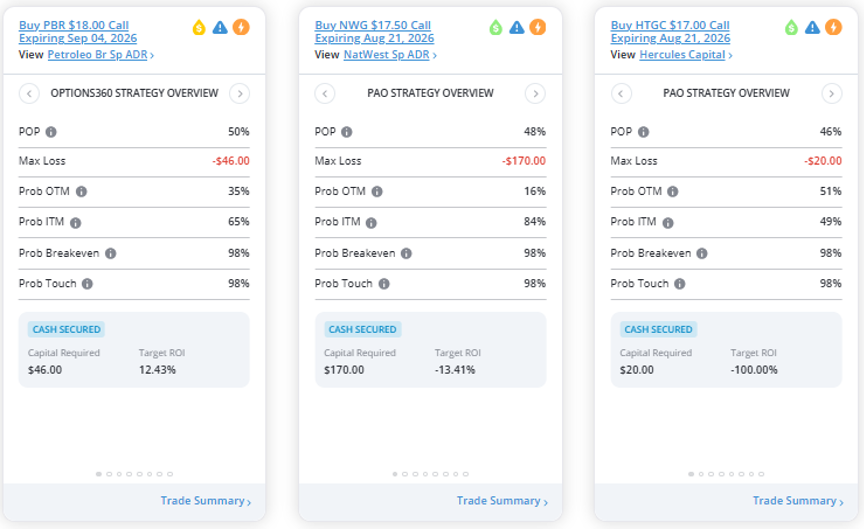
The option tile cards you see displayed in the results screen above have a wealth of additional information about each trade.
At a glance, you can see the option, strike price and expiration date listed at the top – but by clicking on the left and right arrows at the sides of the card, you can view other key details.
Other key metrics featured in these tabs include…
- Our proprietary Probability of Profit (POP) indicator, which displays a calculated probability of earning a profit of any size on the trade…
- The Max Loss of the trade, which for calls is the option premium you paid…
- Prob ITM and Prob OTM, listing the probabilities that the option finishes in or out of the money at expiration…
- Prob Breakeven, the probability that the trade finishes at or better than breakeven…
- Prob Touch, the probability of the stock touching the strike by the expiration date…
- The Capital Required to place the trade…
- The Target ROI, your estimated return on investment…
- And even more.
Armed with the wide range of Options360 metrics, you can more objectively assess the merits of any option trade you find in the Options Screener.
Let’s take a deeper dive into the PBR $18 Call Option expiring on Sept. 4, 2026, just as an example.
Going back to the Option Tile Card, simply click your on the arrow icon to scroll left or right and you can view more data on this option trade:
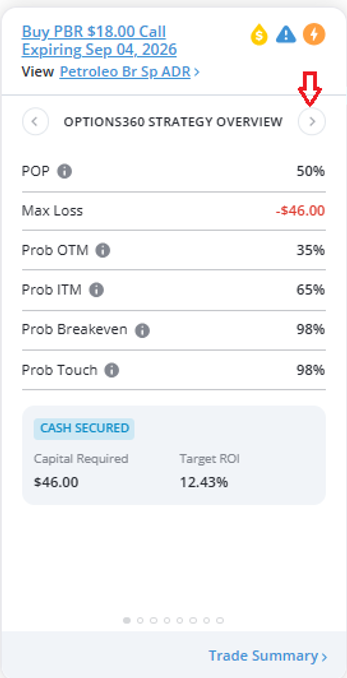
Notice in the Options360 Strategy Overview section that there is a 65% probability the PBR call option is ITM at expiration, but only a 50% Probability Of Profit value.
That’s because to make money on this trade, you need the option to not only be in the money by expiration, but also to gain enough value to cover the initial $0.46 cost to enter the trade.
Clicking the right arrow again will take you to the Option Details section:
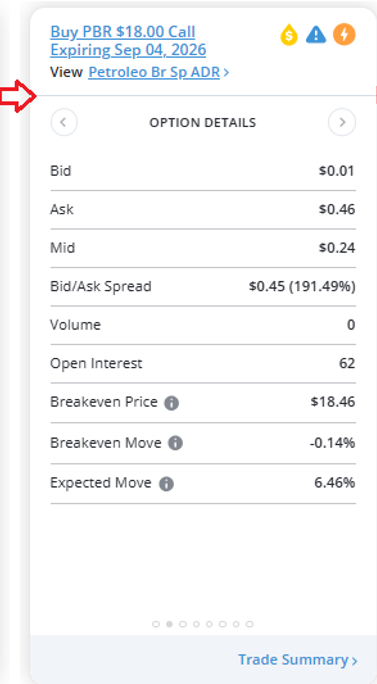
This spells out your breakeven price, $18.46, which is the $18 strike price plus the $0.46 you paid for the option.
Also note the wide option spread between the $0.01 bid and $0.46 ask prices. The Mid price is $0.24 exactly in the middle of the spread – so if you wanted to buy this option, you could try to buy it cheaper with a limit order of $0.24 instead of paying the $0.46 ask price.
Now click the right arrow again, and you’ll find the Underlying Asset Price Forecast graph…
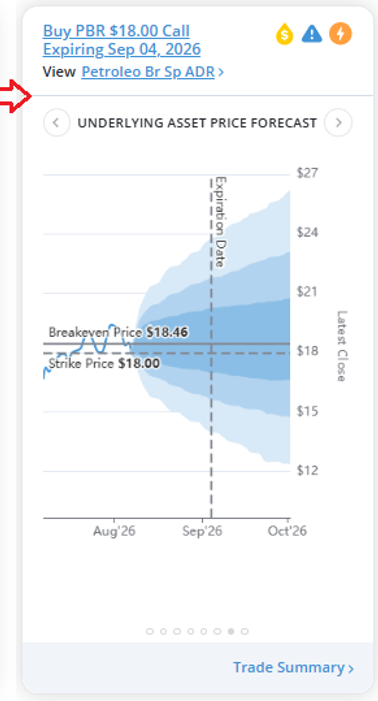
The shaded blue area of this graph charts the probable price range of PBR stock from now through the expiration date of the call option. The strike price of the option and your breakeven price are also displayed, as seen above.
So, this confirms visually what our POP tells you with its percentage value: You have roughly 50/50 odds of this trade being profitable. There is roughly an equal chance of PBR stock prices moving up or down, according to our system’s price forecast.
You can also get a more detailed look at this data by clicking on the Trade Summary link shown at the bottom of the Option tile card. This takes you to the page seen below:
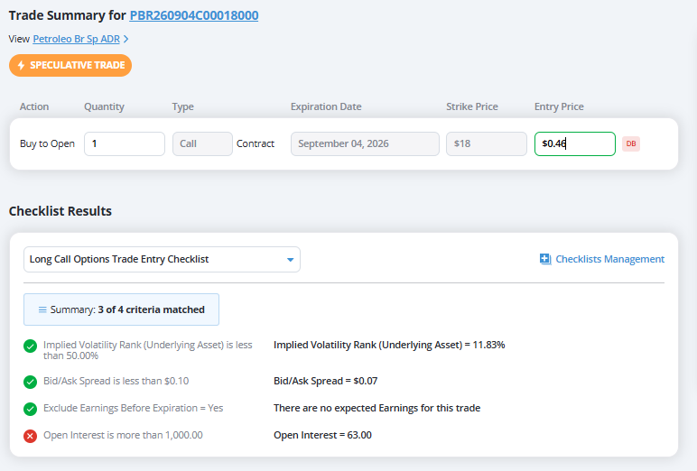
Click on the options symbol link at the top of the page to view all detailed Statistics on the trade, an Overview of the option trade, our Fair Value tool and much more.
Mike Burnick’s Bottom Line: Our Options360 Options Screener lets you zero in on the exact type of option trade that prefer, whether it’s buying puts or calls or selling these options for regular income.
Our data provides you with powerful insights into the underlying stock and its options, so you can make informed decisions with in-depth research before pulling the trigger on any trade.
But that’s not all we’ve added to Options360 in the last few weeks. Stay tuned for news on some even more exciting developments you won’t want to miss…
Good investing,
Mike Burnick
Senior Analyst, TradeSmith