

More positive news on inflation arrived out last week, as the Consumer Price Index (CPI) came in lower than expected last month.
Consumer prices surprisingly declined 0.1% month-over-month in June, while forecasts called for a 0.1% increase.
On a year-over-year basis, CPI rose 3.0%, also below expectations of a 3.1% increase, although that’s still above the Federal Reserve’s comfort zone.
This is good news, right?
It is good IF inflation is coming down for the right reasons. But it’s NOT good if falling inflation is another sign of faltering economic growth.
A scenario of too high inflation plus faltering growth recalls that ’70s phrase: Stagflation.
For those who remember the 1970s era of high interest rates, stubbornly high inflation, slowing economic growth, and waiting in long lines to gas up your car, it’s not a pleasant memory.
And today, some economists are openly discussing a repeat performance of dreaded stagflation!
So, if you thought stagflation, like disco, was long dead, both relics of the ’70s, you may want to think again.
At a recent Federal Reserve policy meeting, Fed chief Jerome Powell was asked point-blank about whether stagflation had returned. His response: “I was around for stagflation, and it was 10% unemployment, it was high-single-digits inflation.” He went on to say, “I don’t see the ‘stag’ or the ‘flation.’”
That’s not really reassuring.
After all, Powell also failed to see inflation as a serious threat when it began accelerating in 2021, calling it “transitory.” As a result, the Fed was initially too slow to tighten rates, allowing inflation to persist and move even higher.
Although it may still be too high for the Fed’s liking, the fact is that inflation is coming down, gradually. But at the same time, we are seeing signs of a faltering economy.
The Federal Reserve Bank of Atlanta publishes estimates of quarterly economic growth in advance, called GDPNow. According to recent data, the economy is expected to grow just 1.5% for second-quarter GDP.
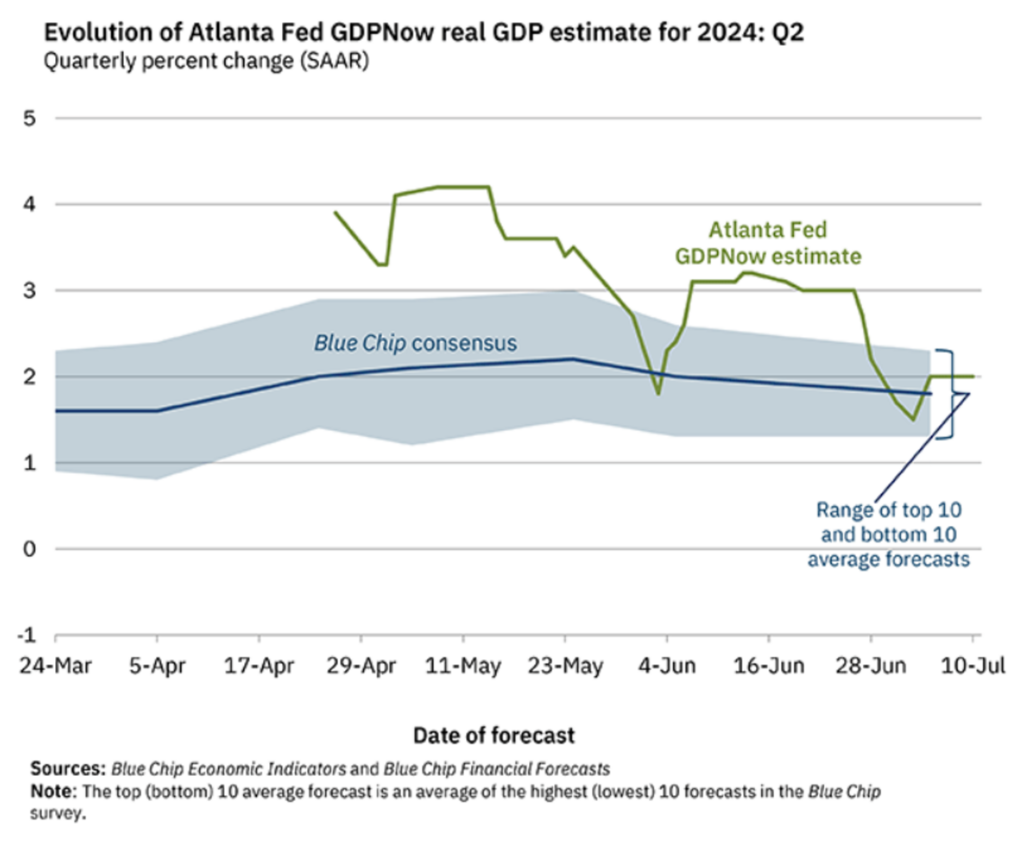
This estimate was published by the Fed on July 3, right after the end of the June quarter, which is the most accurate time to estimate quarterly GDP.
And as you can see above, the consensus estimate of economists isn’t any better, also calling for just 1.5% GDP growth.
And it isn’t just GDP that’s lackluster. Several recent economic data reports have contained negative surprises. In fact, that’s why the Citigroup U.S. Economic Surprise Index has been dropping steadily.
This index simply tallies the number of positive vs. negative surprises in economic data reports. A negative number tells you there have been more negative than positive surprises recently. In fact, the index just hit its lowest level since early 2022 and is now at negative 47.5, as you can see below.
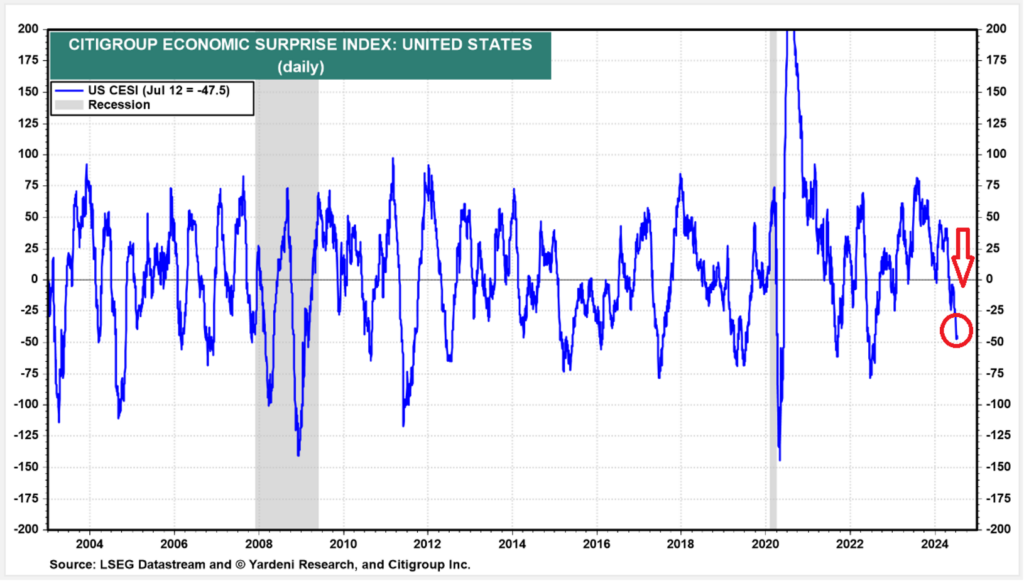
This indeed looks like the possibility of stagflation on the horizon. And if ’70s-style stagflation is ahead, then there are steps you can take now to help protect your portfolio.
As you can see in the chart below, the best-performing investment style during episodes of stagflation has been to own high-quality stocks:
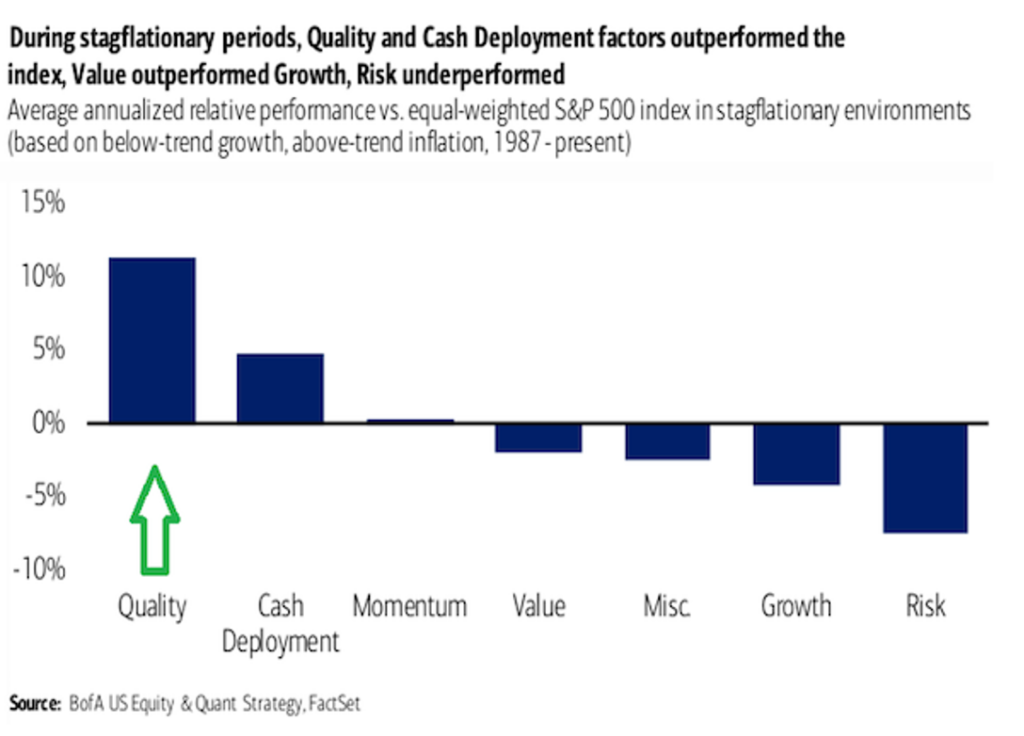
The research says that quality stocks tend to outperform the market by more than 10% annually during periods of below-trend growth with above-average inflation. In other words – during stagflation.
For my money, quality stocks produce strong shareholder returns (return on equity, return on capital, etc.) and high free cash flow thanks to the pricing power of their superior business.
With that in mind, let’s build a simple stagflation screener using Ideas by TradeSmith that can point you to stocks with these attributes. If you don’t see the Screener in your TradeSmith Finance dashboard — and would like to — call 888-623-0858 to discuss.
And we really only need four filters, but you can always add more to make it your own screener tool.
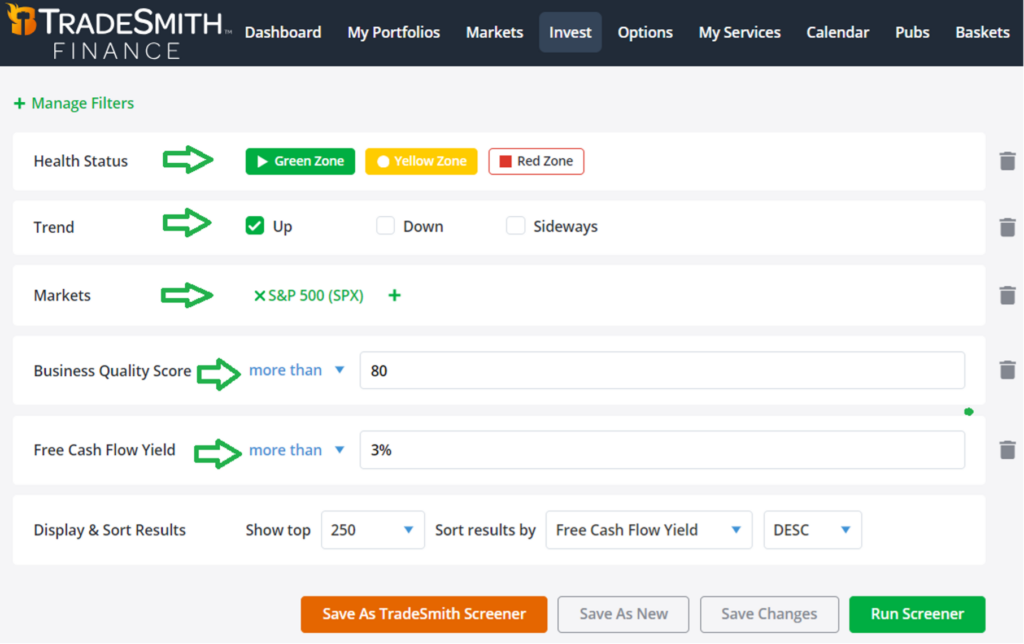
You can quickly and easily retrace my steps by logging into your TradeSmith Finance platform. Click on Invest from the main menu, then Screener and + Create new screener.
Then it’s simply a matter of adding four basic but powerful filters:
- Health Status: Green or Yellow zones
- Trend: Up
- Business Quality Score: More than 80
- Free Cash Flow Yield: More than 3%
Just to recap, here’s some background on these last two metrics.
Our Business Quality Score rates every company based on four broad quality metrics:
- Growth
- Profitability
- Safety
- Payout
Our algorithms calculate the current quality score for each stock compared to its own history and relative to all other stocks in our database. And we rate every stock on a quality scale from 0 (lowest) to 100 (highest).
Meanwhile, free cash flow is how much money a company has left over after paying its operating expenses (costs of running a business) and capital expenditures (buying or maintaining physical assets like buildings and equipment).
Free cash flow isn’t as easily manipulated as earnings per share. A company is either generating real cash or it isn’t.
Free cash flow yield is simply a company’s total free cash flow divided by its enterprise value (the total of equity + debt capital). It’s expressed as a percentage yield, just like dividend yield. And just the same, higher is better.
For this screen I set BQS to more than 80. The resulting stocks will therefore be in the top 20% of all stocks we rate for quality.
As for free cash flow yield, I’ve set this to more than 3%, which is comfortably above the S&P 500 average. And then I sort results by free cash flow yield descending, meaning the highest yield is at top.
Forty stock results passed all my filters. Here’s a sample of the top 10:
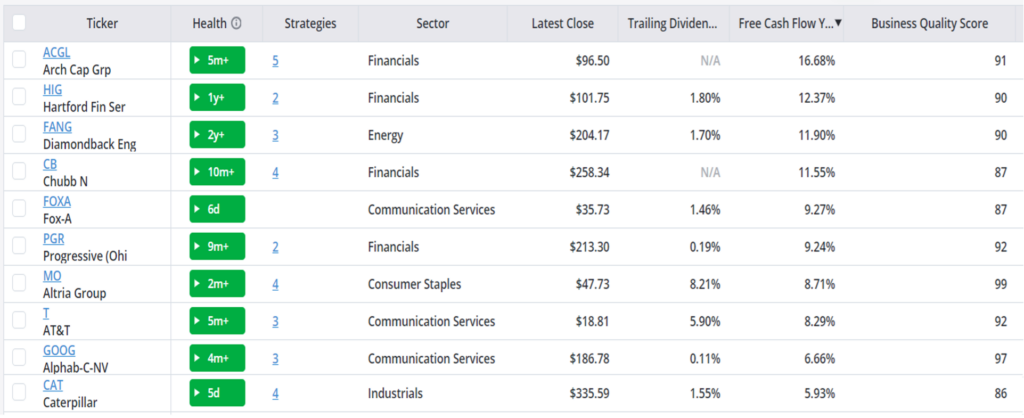
Not surprisingly, most are mega-cap stocks. Perhaps more surprising is that, sorted by free cash flow yield, the only Magnificent 7 stock to make the top 10 is Alphabet (GOOG).
That’s a feature, not a bug.
Remember, free cash flow yield is not only a great measure of quality, but it’s also one of the best valuation metrics you’ll find. In my book, it’s far better than Price-to-Earnings or even dividend yield.
The fact is, the other Mag 7 stocks are pretty darn expensive today, so they don’t land at the top of my list. Microsoft (MSFT), for instance, has a free cash flow yield of just 1.5%, meaning pricey.
Four of the top six results above are financial stocks, while none are technology (GOOG is technically communications services.) But there are more tech stocks further down the list.
Mike Burnick’s Bottom Line: With inflation coming down but still above the Fed’s comfort level, and economic data disappointing to the downside, stagflation is a growing possibility. This quick-and-easy stagflation screener from Ideas by TradeSmith can help you uncover high-quality stocks that are reasonably priced. These stocks should outperform amid stagflation.
Good investing,
Mike Burnick
Senior Analyst, TradeSmith