Make The Most Of Bollinger Bands – TradeSmith’s Dip-Buying Playbook, Part 2
In my last Inside TradeSmith issue, I covered our exclusive Snapback Strategy and how you can use it to find potential buy-the-dip opportunities in stocks across the market.
When I checked my TradeSmith Finance platform again, first thing Monday morning, there were still no new results for Snapback stocks.
But the good news is, this is just one of 10 proven trading strategies available to members with subscriptions to Ideas by TradeSmith, Trade360, and TradeSmith Platinum.
And there are plenty of potentially profitable trade ideas among our other strategies.
In today’s issue, I’ll show you how to use one of my personal favorites of the 10, as we profile our powerful Bollinger Bands Strategy.
What Are Bollinger Bands?
Headlines have been rough on the stock market recently. As increasing conflict in Iran sends oil prices skyrocketing and volatility increasing, investors took yet another blow on Friday after a concerning jobs report.
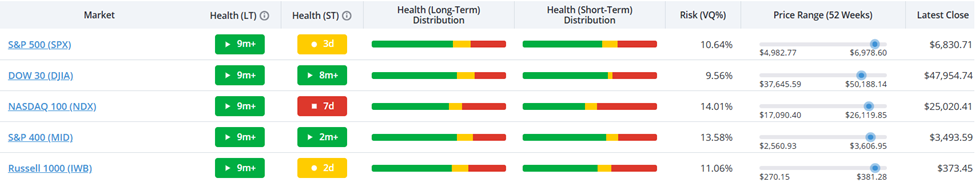
As a result, signs of deterioration in the stock-market rally are beginning to show up in our TradeSmith Health indicators…
The S&P 500 and Russell 1000 are both in the Short-Term Health Yellow Zone. And the tech-heavy Nasdaq 100…well, that index has fallen into the Short-Term Health Red Zone:
But remember, today’s volatile markets are par for the course to experienced investors.
Savvy traders and long-term investors alike know that uncertainty also delivers opportunity – in the opportunity to buy quality stocks at a discount before they rebound.
After all, that’s the goal: “Buy low, sell high.” And to help investors do just that, TradeSmith developed the Bollinger Band Strategy.
It aims to profit from oversold stocks – similar to the Snapback Strategy we covered last week, but by using an entirely different set of indicators.
The Bollinger Bands the strategy is named after are a popular technical indicator, developed by the legendary John Bollinger. The bands consist of three lines:
- The Middle Line, which is the stock’s moving average (MA)…
- The Upper Band, two standard deviations above the MA…
- And the Lower Band, two standard deviations below the MA.
The Bollinger Bands create a “channel” around an asset’s moving average. Here’s an example, using the chart for the SPDR S&P 500 ETF (SPY):
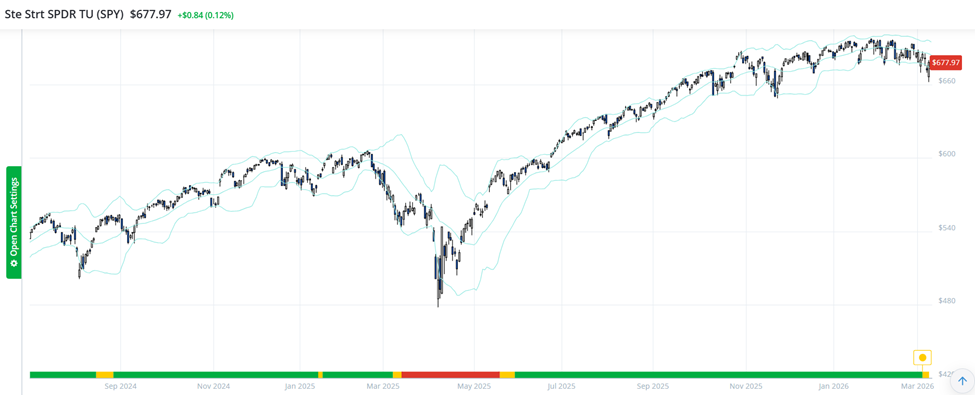
At a glance, the channel formed by these three lines tell you how far prices normally move up or down. Note how the stock price (in black) sticks within the channel – and how it didn’t spend much time outside the channel, when the price fell below the Lower Band.
By using the Bollinger Bands, there’s no need to guess whether a stock’s price is oversold or overbought. It all shows you exactly where price is within the recent range – overbought or oversold – and that’s the key to our winning strategy.
Use Bollinger Bands to Buy the Dip
Similar to the Snapback Strategy, our Bollinger Bands strategy aims to buy stocks that are oversold, expecting a rebound back to at least a neutral level.
It’s like a pendulum that swings too far in one direction, and is then poised to swing back sharply in the opposite direction. You can see these swings on a Bollinger Bands chart when the stock price within the channel moves from high to low and back again – like clockwork.
Our TradeSmith Bollinger Bands Strategy searches for stocks that are oversold, near or below the Lower Band:
- If the stock is oversold based on the bands for three consecutive days, it triggers a buy signal…
- Then we exit the trade after 21 trading days – OR once the stock has bounced back to its moving average, and returned to an area near the Middle Line.
Keep in mind that just like any indicator, the Bollinger Bands won’t work 100% of the time. But in our backtesting, we found that:
- 74.1% of all trades made with Bollinger Bands signals were closed with a gain…
- And 78.2% of the strategy winners outperformed the S&P 500.
To access our powerful Bollinger Bands Strategy for yourself, simply log in to your TradeSmith Finance Dashboard. Select Invest from the main menu, then click the Strategies tab in the sub menu.
Finally, scroll down the page to find the Bollinger Bands window:
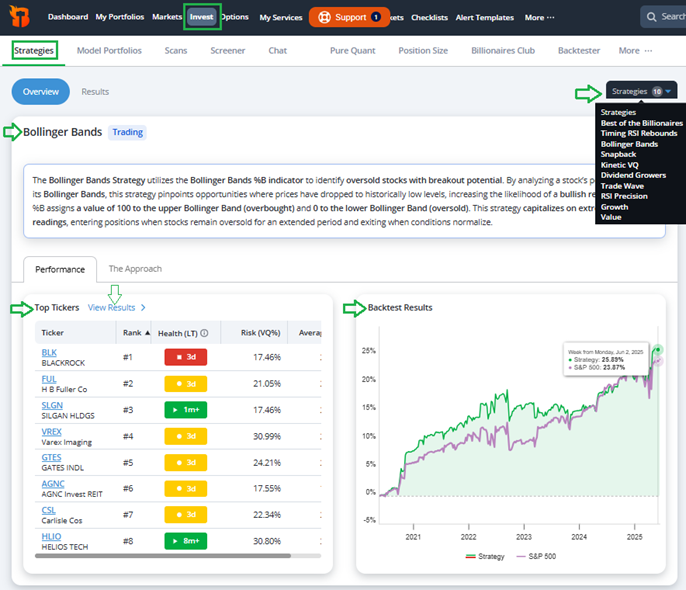
At the left of the window, you’ll see the top stock tickers that currently qualify for the strategy. These appear in ranked order.
And at right of the window are the backtest results of our Bollinger Bands strategy, showing how it outperformed the S&P 500!
As a side note, at the upper right of this page, you can click the Strategies dropdown tab to quickly jump to view any other TradeSmith strategy you have access to.
And if you’d like to see more opportunities, simply click on the highlighted View Results link at the left of the Bollinger Bands window. This will take you to the TradeSmith Screener page, to display even more Bollinger Bands strategy results:
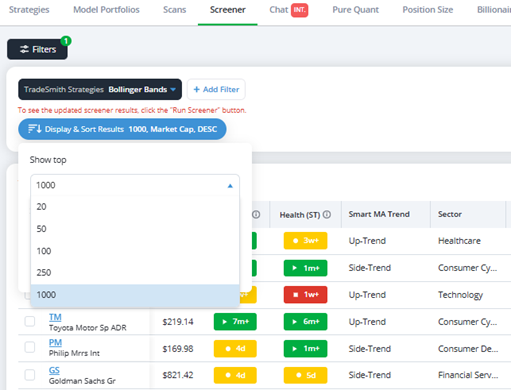
You can choose the number of results you want to see at once, up to 1000.
From this Screener page, you can also add other filters to customize your search or narrow the results down to a more manageable number for more research.
For instance, I added our exclusive Business Quality Score (BQS) to this screener. I set the BQS filter to more than 85 – limiting the results to only the top 15% of stocks we’ve rated for quality.
Next, I sorted the list by Health (Short-Term). So, stocks that recently flashed a (ST) Health Indicator buy signal are at the top. These are stocks that have just entered the Short-Term Health Green Zone.
As you can see below, several blue chips have triggered buy signals within the past few weeks, including Universal Health (UHS) and Trane Technologies (TT), among others…
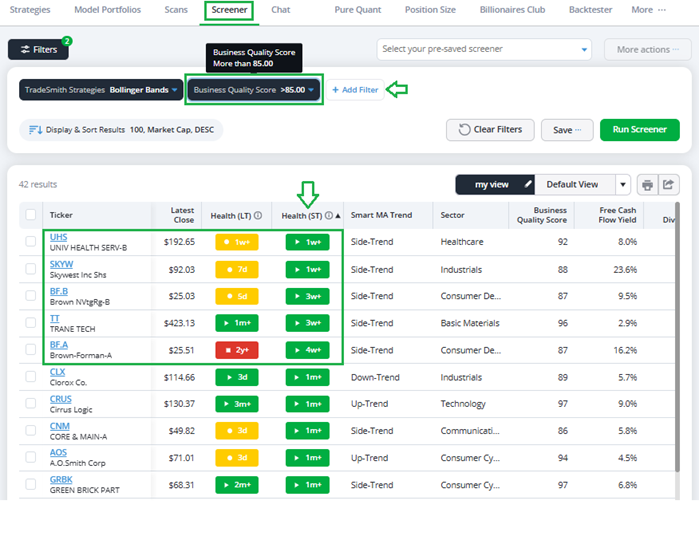
These stocks also command very high BQS ratings, in addition to qualifying for our Bollinger Bands strategy.
Even in down markets, quality stocks get oversold. But when those same stocks trigger new buy signals, they’re poised for a profitable rebound!
Mike Burnick’s Bottom Line: Our Bollinger Bands strategy is tailor-made for volatile markets where stocks get sold indiscriminately, often to oversold extremes.
Savvy traders and investors armed with this strategy can consider buying these dips for a quick bounce back in price.
Good investing,
Mike Burnick
Senior Analyst, TradeSmith
P.S. The Bollinger Bands and Snapback Strategies we’ve covered recently are just two of TradeSmith’s many market-scanning tools and strategies. But they’re just two pieces of a much larger toolkit.
Today, markets are more volatile than ever. Headlines are driving investors to panic, and that panic is driving stock prices down further and further. It’s par for the course for experienced investors and traders… but even the most experienced of us need to be prepared, if they’re going to make the most of this market environment.
That’s why TradeSmith’s CEO, Keith Kaplan, is going live for his Tipping Point online event. Keith believes the current volatility could be the start of a much larger drop… and if that comes to pass, you’ll need all the tools you can get.
Click here to find out all the details from Keith. You won’t want to miss this.