Mark Your Calendar with Trade Cycles: The Most Bullish Season of the Year is About to Begin!
As I’ve mentioned in earlier issues, it’s well known that September is the most bearish month of the entire year for stocks, historically speaking. Over the past 75 years, the S&P 500 has ended September higher just over four times out of 10.
But so far… September hasn’t lived up to its bad reputation in 2025.
Instead, the S&P 500 Index is up 3.5% so far this month, hitting new record highs in the process.
As you can see below, the typical seasonal trend for the S&P 500 (blue line) calls for a dip in stock prices at this time of year. But it hasn’t happened, at least not yet. The 2025 year-to-date trend (red line) has refused to turn down:
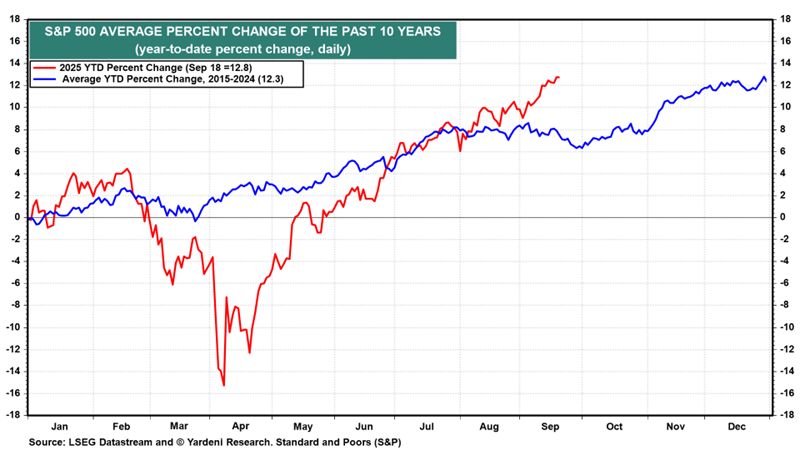
But September isn’t over just yet.
Remember: The market’s worst historical performances have come in the back half of this month…
The good news is that any delayed weakness in stocks that does unfold should very quickly give way – leading into a powerful year-end rally. Historically, that rally typically begins in October, accelerates in November, and should carry the S&P 500 higher straight into the new year.
And that means you should pay close attention to our Trade Cycles Seasonality tools. There is a big crop of fresh seasonal buying opportunities coming up in the weeks ahead – and our tools offer everything you need to make the most of them.
Clear Your Schedule for a Windfall of Seasonal Opportunities
The thing about stock market seasonality is that the strongest opportunities tend to come in bunches at certain times of the year. So, during September – which is typically a negative seasonal period – there were very few opportunities at all.
But to quote our residentseasonality expert, Trade Cycles Analyst William McCanless: “October into January is the most bullish time of the year, and there are endless long opportunities. In fact, you can often make most of your money for the entire year during this period.”
And just a quick glance at our Trade Cycles Seasonality Calendar will tell you that William wasn’t kidding: There’s a target-rich seasonal trading environment just ahead of us!
The Trade Cycles Seasonality Calendar gives you the ability to pinpoint potential bullish seasonal patterns for individual stocks. These are the historically reliable periods when certain stocks trend higher, and they repeat year after year.
With the Seasonality Calendar, you can get a day by day (or week to week) view of these seasonal trading opportunities – and easily plan your trades over the next three months, six months, or even the next year in advance!
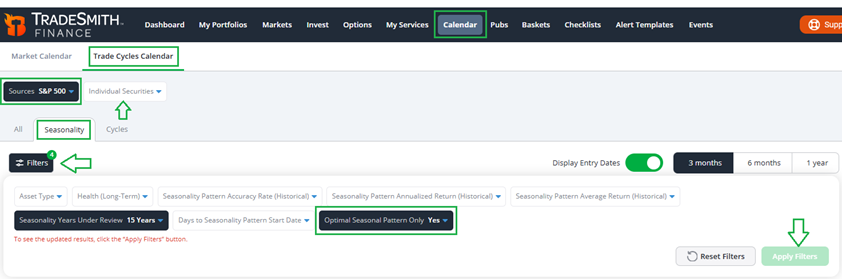
To access our Trade Cycles timing tools, including this handy calendar of upcoming bullish seasonal patterns, simply log in to your TradeSmith Finance Dashboard and open the Calendar page from the main menu bar up top.
Next, select the Trade Cycles Calendar tab on the following page to pull up the calendar:
Members with subscriptions to Trade Cycles and TradeSmith Platinum can access this page. If you don’t see this valuable tool in your TradeSmith Finance platform – and you’d like to – give our Customer Care team a call at 888-623-0858 to find out how to get access.
Once you’ve opened the Trade Cycles Calendar, open the drop-down menu at the top of the page, labeled Sources. From this menu, you can select any of your saved portfolios or watchlists to review any upcoming seasonal windows.
Alternatively, you may also select any Newsletter portfolios you’re subscribed to – or any of TradeSmith’s proprietary stock baskets, for that matter.
You can also enter a specific stock ticker symbol into the Individual Securities box next to the Sources menu to find potential seasonal patterns for any stock you like!
Further down the page, under the Filters tab, we’ve included several preset filters including Asset Type (stock, crypto, commodity, etc.), Health (Green, Yellow, Red zone), and specific seasonality filters — all to help you zero in on the best upcoming opportunities.
To illustrate, I chose the S&P 500 Index as my source, which you’ll find under the TradeSmith Baskets tab. Plus, I chose the filter for Optimal Seasonal Patterns Only and toggled it to Yes.
We did extensive research to find stocks with the most ideal seasonal patterns and the highest win rates. To qualify for Optimal Seasonality the stock must have…
- A historical accuracy rate of 80% or higher…
- An average historical return of 4% or more…
- Annualized return of 20% or greater…
- And at least 15 years of historical data.
With all my options set, I simply click on the green Apply Filters button to see my results in the Calendar view – which you can see for yourself below:

As you can see, there are plenty of opportunities to choose from in the coming weeks. By my count, there are 19 Optimal Seasonal Patterns starting in October and November alone… And that’s just scratching the surface of the S&P 500 – alphabetically, I’m still in the letter “A!”
The green shaded calendar periods labeled UP display the exact start and end dates of these bullish trading windows. Simply hover over the shaded period for any stock, and a pop-up gives you all the key details about the optimal seasonal pattern.
For example, semiconductor giant Broadcom (AVGO) enters an Optimal Bullish seasonal window that opens on Oct. 24 and closes on Dec. 13. Historically, AVGO shares haves been up 93.3% of the time during this period over the last 15 years – posting average returns of 12.96%!
And thanks to our Seasonality Calendar, we have more than enough lead time to research the stock and its upcoming bullish period before deciding whether to open a new position or not. No need to rush!
By clicking on the ticker symbol at the left of the results, you can jump straight to AVGO’s Asset Details page – where you can review the stock’s Health and Risk ratings, browse recent financial results, or even take a deep dive into the upcoming bullish window via the Trade Cycles tab.
And for those who want a little more guidance, having access to the Trade Cycles Market Calendar means you also have access to one of TradeSmith’s biggest breakthroughs – in the form of our Seasonal Edge automated trading system.
Seasonal Edge scans the component stocks of the S&P 500 at the start of each year, to identify the top 50 stocks in the index that exhibit the strongest historical seasonal patterns. The system then keeps tabs on those stocks and their trading windows for you.
When each of these potent bullish windows is about to begin, Seasonal Edge tests the stock’s Relative Strength Index (RSI) to confirm that price momentum is still optimal, and that the stock is still primed for potential profits.
If (and only if!) the stock still passes the test, the Seasonal Edge system sends a timely email alert with all the details – right down to the exact day to enter and exit each trade.
Just be prepared as we enter October: If these stocks still get the all-clear, our system will be sending plenty of emails in the weeks to come!
Mike Burnick’s Bottom Line: For my money, our Trade Cycles Seasonality Calendar is the easiest and best way I know of to uncover bullish seasonal trading opportunities in stocks well before they begin. And in terms of sheer opportunity, October is setting up to be the busiest bullish seasonal period you’ll see all year.
The number of bullish patterns you find in the Calendar right now is enough to make your head spin – and I’ll be looking forward to the opportunities, however September turns out!
Good investing,
Mike Burnick
Senior Analyst, TradeSmith
P.S. The Seasonal Edge system – and our Trade Cycles Seasonality tools – are some of the most powerful trading assets ever developed at TradeSmith. I’m glad to have them in my toolkit!
As we enter the most bullish period of the year for the markets, our seasonality and timing tools make it easy to find the best potential profit opportunities on the market – and even plan your trades months in advance. But as we saw earlier, there are almost too many opportunities to choose from.
In times like this, I like to follow the big fish… and turn to another of TradeSmith’s groundbreaking systems: Quantum Edge, our quantitative analysis software designed and refined to track the big money moves made by the financial elite.
Built by a Wall Street veteran who became a partner at Cantor Fitzgerald at just 26, after years of executing billion-dollar trades for Wall Street elites, the Quantum Edge system tracks massive money flows and uses quantitative analysis to spot explosive stock moves before they hit the news… so you can make the most of the opportunity.
The latest updates and upgrades to this cutting-edge system have made it one of the most effective tools in the TradeSmith catalog: Backtests show it could have delivered 8,100% gains since 1990, crushing the S&P 500 by more than 5-to-1.
It’s one of the most versatile tools in the TradeSmith arsenal, and one you’ll want to keep in your back pocket as we look ahead to the end-of-year bullish period. Keeping tabs on these major cash flows can be the difference between life-changing profits… and getting left behind.
To learn more about this quant system – and how you can use it yourself, click here.