

The stock market has a case of bad breadth right now, and the S&P 500 Index is doing a good job of hiding it. The Index just hit a new all-time high last week.
But dig a bit deeper beneath the market’s surface, and you’ll see all is not well.
While the index itself sits at all-time highs, nearly 60% of S&P 500 stocks are down 20% or more this year.
These stocks are stuck in their own private bear markets. Meanwhile, just a handful of big-cap tech stocks are keeping the index afloat.
Check Market Breadth with Market Outlook
You can keep a watchful eye on market breadth for the major indexes, sectors and individual stocks by visiting our TradeSmith Market Outlook page.
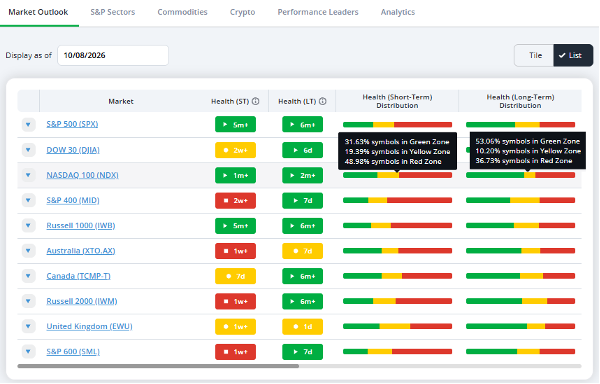
Subscribers can view this important market breadth data by clicking Markets from the main menu, then Market Outlook, and selecting the List view.
In the Health (Short-Term) Distribution indicator column on the left above, you can see that most market indexes are still in the Health indicator green zone.
The exceptions are the Dow Jones Industrial Average (DJIA) which is yellow, and the S&P 400 Mid-Cap (MID), which flipped red two weeks ago.
The ST Health indicator is designed to reflect current market trends over the past several weeks to months. And right now, while the U.S. stock indexes are mostly green, every one of them has more ST Health Red Zone than Green stocks!
Beneath the surface, the share of healthy stocks in each index is deteriorating.
Just hover your mouse over the Green, Yellow, and Red Health Distribution bars above to view details about the current Health of that index.
For instance, the leading Nasdaq 100 Index (NDX) also hit new highs last week. But the Health (Short-Term) Distributioncolumn shows that just 31.6% of NDX symbols are in the Green Zone right now, while 49% are red!
Another 19% of NDX symbols are yellow, meaning they’re still healthy but have fallen more than halfway toward the red zone.

The S&P 500 Index (SPY) above is even worse, with just 26.2% of stocks in the ST Health green zone and 54.7% in the red.
The good news, however, is that our Health (Long-Term) Distribution, on the right of the Market Outlook page, shows the indexes remain healthy, with most symbols also in the Green Zone. This indicator reflects market trends over several months to a year or so.
For example, in the first screen shot above, you can see the Nasdaq 100 still has 53% of symbols in the LT Health Green Zone and just 36.7% the red. The LT Health Distribution for the S&P 500 is similar.
What this tells me is that the stock market is sending mixed messages right now. Most of the stocks that make up the index have unhealthy near-term trends, but they are much healthier over the longer term.
Take a Deeper Dive into the Health of S&P 500 Sectors
From the Markets page, simply click on the tab labeled S&P Sectors.
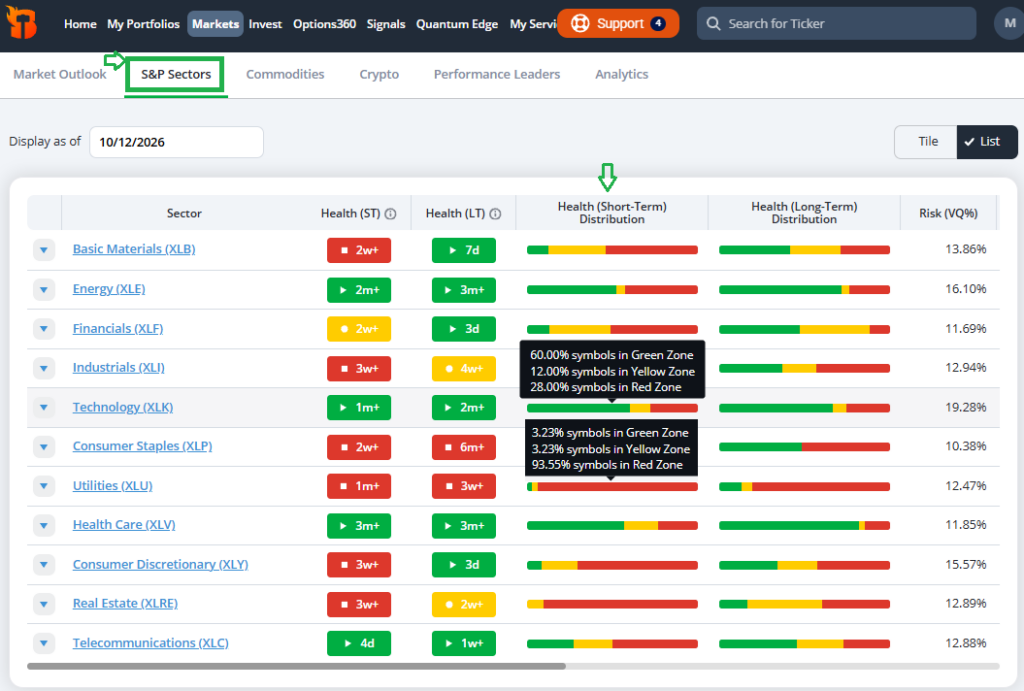
Here you’ll find the Health Distribution by sector, both ST and LT.
Notice Technology (XLK) is the best sector according to ST Health Distribution, with 60% of stock symbols green and only 28% red. The unhealthiest sector is Utilities (XLU), with 93.6% of stocks glaring red!
You can also view the LT Health Distribution by sector when hovering your mouse over the color-coded bars in this column.
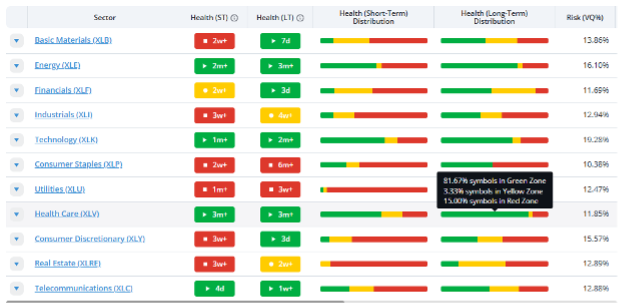
In this case, Health Care (XLV) has the best LT Health distribution at 81.7% green, while the unhealthiest sector is again XLU, with just 12.9% of symbols green.
How to Dig Deeper to Find Healthy Opportunities
Let’s take a closer look at XLV.
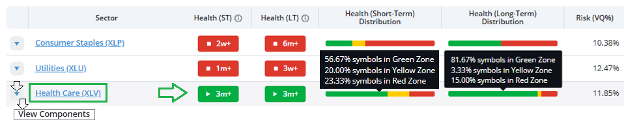
What I find attractive for Health Care is that both its ST and LT Health are green. The Health distribution is also bullish for individual stocks in the sector, as you can see below.
- 56.7% of XLV symbols are ST Green, with 81.7 LT Green!
- That shows me strength across the board over different time frames. No mixed signals here.
- XLV is also a relatively low-risk sector, with a TradeSmith Risk (VQ%) rating of just 11.9%.
That’s the third-lowest risk rating of the 11 S&P 500 sectors. Technology, by contrast, has a VQ% of 19.3%.
Finding New Flash Buy Signals
Now, simply hover your mouse over the down arrow in the far-left column above and click on View Components to check the Health status of all 55 stocks in the Health Care sector.
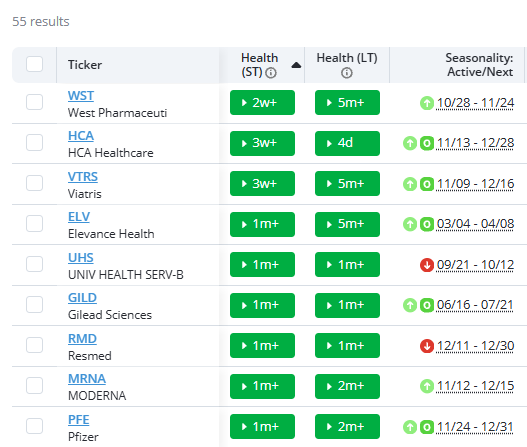
Due to space constraints, this is a partial list. I’ve sorted it by Health (ST), so stocks that most recently flashed green are at top.
Traders and investors can use changes to the Health (ST) indicator as a “flash buy” signal for that stock. And you can see that three stocks in the sector just flashed buy signals within the past three weeks.
The next six stocks on the list above have flashed buy signals over the past month or so.
Stocks like these, which are Health (LT) green and recently flashed Health (ST) green, are prime candidates to review as potential additions to your stock portfolio.
For extra confirmation of a possible winning trade, check the column at the right above, labeled Seasonality Active/Next.
Note: Trade Cycles subscribers and our TradeSmith Platinum members can see this indicator and use it to spot bullish Seasonality periods coming up soon.
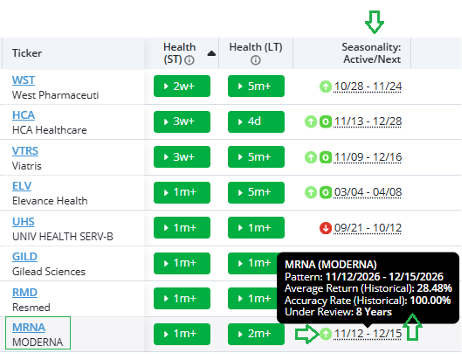
Just hover your mouse over the date range in this column to view historical details about the upcoming Seasonality periods.
For instance, Moderna (MRNA) has a bullish seasonal period from 11/12/2026 to 12/15/2026.
During this period over the last eight years, MRNA has delivered an average return of 28.5%, with a 100% accuracy rate!
Keep in mind, this doesn’t guarantee a move of this magnitude for MRNA this year. But our detailed Seasonality data can serve as a guide to how consistently a stock has performed in the past.
You can also click on the ticker symbol in the left column to view the stock’s Overview page. From there, you can more fully evaluate the stock as a potential investment or trade using more of our proprietary TradeSmith data for Health, trend, risk, plus detailed fundamental and technical statistics.
Mike Burnick’s Bottom Line: I always keep a watchful eye on stock index and sector trends, looking for the healthiest sectors and stocks. This can be a timely guide to overall market health. Plus, by drilling down into the component stocks within each sector, you can find recent ‘flash buy’ signals – when our ST Health Indicator turns green – that can quickly alert you to potential new buying opportunities.
Good investing,
Mike Burnick
Senior Analyst, TradeSmith