Markets in Flux: Tariffs, Seasonality, and Stock Trends
The biggest news weighing on financial markets right now are trade tariffs.
Tariffs rocked markets yesterday because many assumed the Trump administration was merely bluffing in order to cut a better “art of the deal” with our key trading partners. Imported goods from Canada, Mexico, and China account for 11% of the U.S. economy, as measured by GDP, and 43% of those imports come from those three countries.
So, the 25% tariffs on Canada and Mexico, along with 10% tariffs on China, directly impact roughly 5% of GDP. That has the potential to move the needle on our economy’s growth in the wrong direction.
And that doesn’t include the potential retaliatory tariffs by those countries against U.S. goods and services. Depending on how long it drags on, the new trade war could be a big deal.
There’s still the possibility it’s just a tactic to bring our key trading partners to the negotiating table. let’s hope that’s the case.
However, longer-term seasonal trends are also in play – which means the mood of the market isn’t all cautionary – and a new month brings new opportunities for seasonal trading profits.
Today, let’s take a sneak peek at the Trade Cycles Seasonality calendar to uncover some of these potential gains…
February’s Optimal Seasonal Patterns
To access these valuable tools and see what the hard data suggests about the future, simply click on Calendar from the top main menu bar of TradeSmith Finance. If you don’t see this tool in your TradeSmith Finance platform – and you’d like to – give us a call at 888-623-0858.
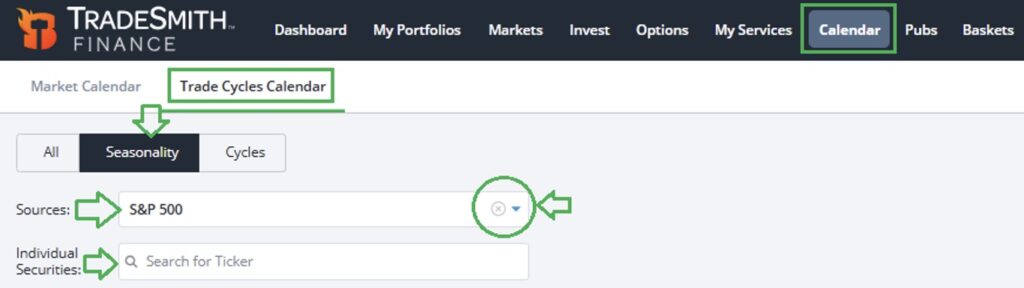
Next, click on the Trade Cycles Calendar, then open the drop-down menu labeled, Sources. From this menu, you can select any of your saved portfolios or watchlists.
Alternatively, you can select Newsletter portfolios you’re subscribed to or any of TradeSmith’s proprietary stock baskets. You can also enter a specific stock ticker symbol into the Individual Securities box.
In the screenshot above, I simply clicked the TradeSmith Baskets tab and chose the S&P 500 Index. That will bring you to this view shown below:
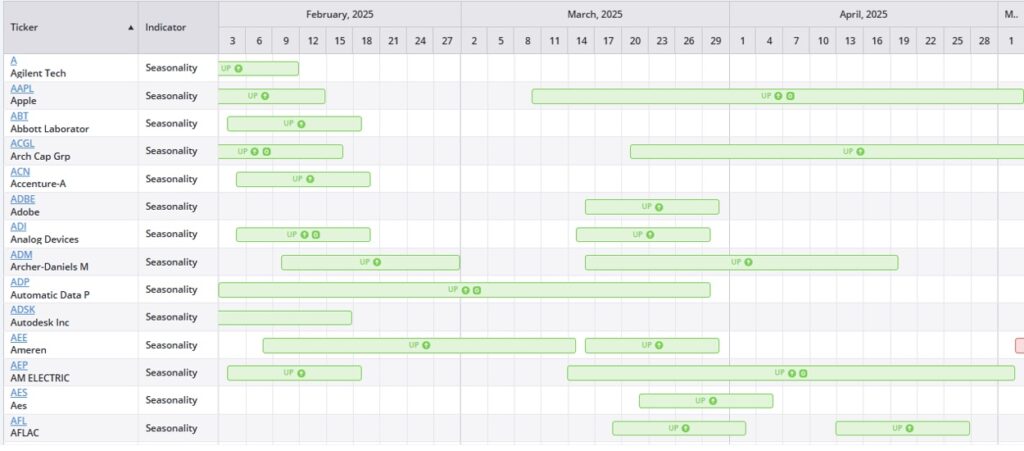
TradeSmith Seasonality tools give you the ability to pinpoint potential bullish and bearish seasonal patterns for individual stocks – calendar periods where certain stocks tend to move consistently up or down in value — year after year.
The Seasonality Calendar view allows you to scan a list of stocks for the seasonal trading windows up to six months in advance.
The shaded calendar periods labeled UP and DOWN display the exact start and end dates of these trading windows. This way, you know in advance when a particular stock has the greatest potential for upside gains or downside risk.
Let’s take a look at a few S&P 500 stocks as examples to illustrate these seasonality tools:
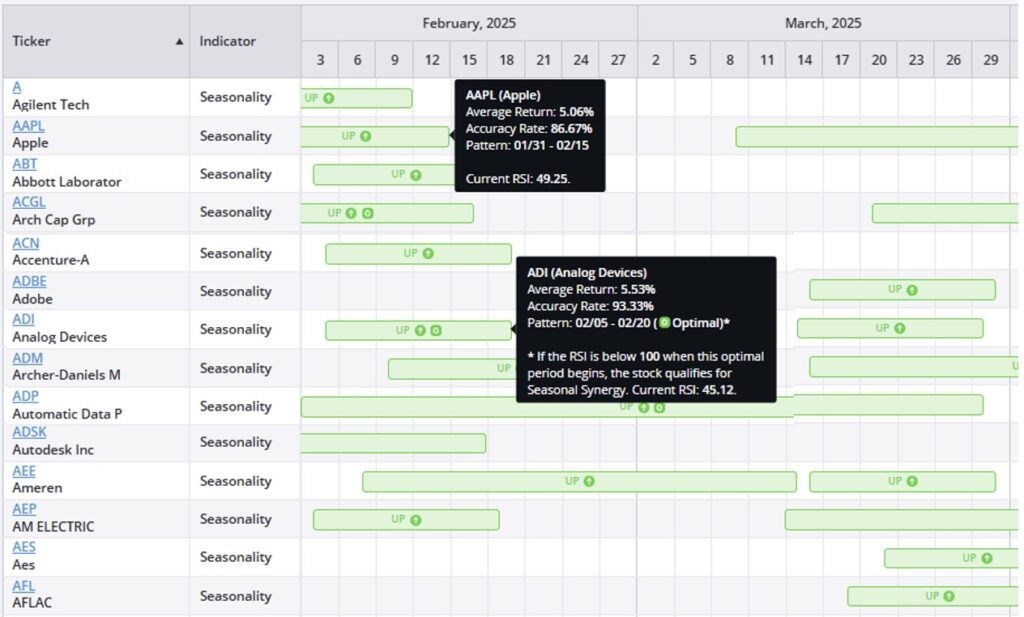
And as you can see above, 10 of the 14 S&P 500 stocks listed (sorted alphabetically) enjoy bullish seasonal trading patterns during February!
For example, Apple (AAPL) enters a bullish seasonal window that opens on Jan. 31 and closes on Feb. 15. Historically, during this period, AAPL shares haves been up 86.7% of the time, posting average gains of 5.06%!
Some of these seasonal trading windows are labeled Optimal. For example, Analog Devices (ADI), also shown above, has an optimal seasonal pattern – according to our Seasonal Edge trading system. An optimal seasonal pattern gives you extra confidence in the trade, based on our back-tested criteria.
To qualify as an optimal seasonal edge trading pattern, the period must meet all of the following conditions:
- A historical accuracy rate of 80% or higher…
- An average historical return of 4% or more…
- Annualized return of 20% or greater…
- And at least 15 years of historical data.
In the case of ADI, the stock has maintained a 93.33% accuracy rate over the past 15 years, with an average historical return of 5.35%. Another key factor for our Seasonal Edge system is price momentum, as measured by its Relative Strength Index (RSI).
Our Seasonal Edge trading system scans all S&P 500 stocks annually to identify about 50 that exhibit the strongest historical seasonal patterns.
We then wait patiently for the final signal to enter the trade – when the RSI value confirms that price momentum for that stock is optimal for a live seasonal edge trade. At that point, we send you a trade alert email to consider taking the trade that is primed for potential seasonal profits.
Mike Burnick’s Bottom Line: Our Trade Cycles Seasonality Calendar is the best and easiest way I know of to uncover stocks about to enter a historically bullish seasonal window. And our Seasonal Edge trading strategy provides advanced insight into which S&P 500 stocks have upcoming optimal seasonal periods and when they begin and end – right down to the exact day to enter and exit the trade. For more details, simply click here to learn more about Seasonal Edge
Good investing,
Mike Burnick
Senior Analyst, TradeSmith
P.S. Identifying optimal seasonal trading windows gives investors a powerful edge – but some market shifts go beyond historical patterns.
Right now, we are on the brink of something huge: Artificial General Intelligence (AGI) – AI that can reason like a human – is advancing faster than expected, and the countdown to its arrival has already begun.
Last September, my colleague Eric Fry at InvestorPlace started a 1,000 Day Countdown to AGI.
The New York Times warns this breakthrough will “split history before and after.” Some experts predict it could arrive within two and a half years – possibly even sooner.
History shows that the biggest wealth transfers happen before new technology becomes mainstream. Those who recognized the internet in the ’90s, AI before ChatGPT, and Bitcoin before its breakout saw life-changing gains.
This is a moment like those.
That’s why Eric has been tracking AGI’s rise and pinpointing investment plays poised for exponential gains. The key is positioning yourself now, while we’re still in the “pre-AGI” phase.
And he has identified several companies set to benefit from this shift and sharing them in an urgent briefing.
Click here to watch his 1,000 Days to AGI special presentation before this window closes.