Search Out Quality with the Newly Upgraded TradeSmith Screener
As we discussed in yesterday’s special alert issue, we’ve entered a period of major market uncertainty in the past few days.
With the key stock market indexes in the U.S. and abroad falling into our Health Indicator Red Zone and “Bearseye” downside signals triggering across the market, it’s a poor time to pick up new positions… at least without doing more than your due diligence beforehand.
But even though our research suggests that investments in the Red Zone should be avoided, that doesn’t mean that opportunity has left the market. It just means that you’ll need to be more selective about where and how you invest.
When it comes to finding promising investments, especially in volatile times like these, the first thing I look to is our powerful and popular TradeSmith Screener tool.
That’s because our Screener can tie together ALL of our powerful data analytics, indicators, and strategies into one convenient package, giving you one easy to use tool for all your investment researching needs. And it’s all easily accessible to you, too – just a few mouse clicks from your TradeSmith Finance Dashboard!
I personally use the Screener tool on a daily basis – several times each day, even. It’s my go-to tab on TradeSmith Finance… and as you may have noticed, it recently got a major upgrade.
Even in stressful market environments, the TradeSmith team is always striving to improve our data analytics, indicators, strategies and other valuable tools on the TradeSmith Finance platform, to keep you well-equipped for whatever the market throws at you.
And our esteemed “mad scientists” in the TradeSmith software development lab have just scored a homerun in that respect – rolling out another big upgrade to our TradeSmith Screener tool.
We’re sure you’re going to love the new layout and easy to use functionality improvements. Today, I’ll show you step by step just how easy it is to use, and how you can use the Screener to combine multiple filters to find potential money-making opportunities in seconds – even in today’s uncertain market.
So, if you haven’t seen the new and improved screener page already, let me take you on a brief guided tour today by showing you how to recreate a powerful stock screener of mine.
Touring the New and Improved TradeSmith Screener
First, log into TradeSmith Finance to get started.
Then from the main Dashboard page, access the Screener tool as you always have: Click on the Invest option at the top of your Dashboard, then click on the Screener tab. This will take you to the redesigned page, shown below:
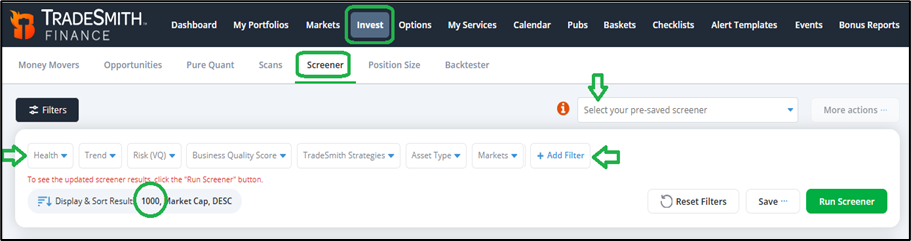
Though the Screener may look different, it’s still just as powerful – and now, it’s much faster to customize as you wish. The most commonly used category filters will appear by default, now as a series of dropdown menus in a row at the top of the screener, just under the Filters icon.
Select each dropdown to configure your filter options. Or, at the upper right of the page, you can Select your pre-saved screeners using the drop-down menu.
All your previously-saved screeners now live in this menu to the upper right – no need to fiddle with a different page anymore!
You can easily adjust your preferences and add more filters to your scanner by clicking the +Add Filter button. Simply click the button, and a menu will appear with all our screener filters – now conveniently arranged by filter type, as shown here:
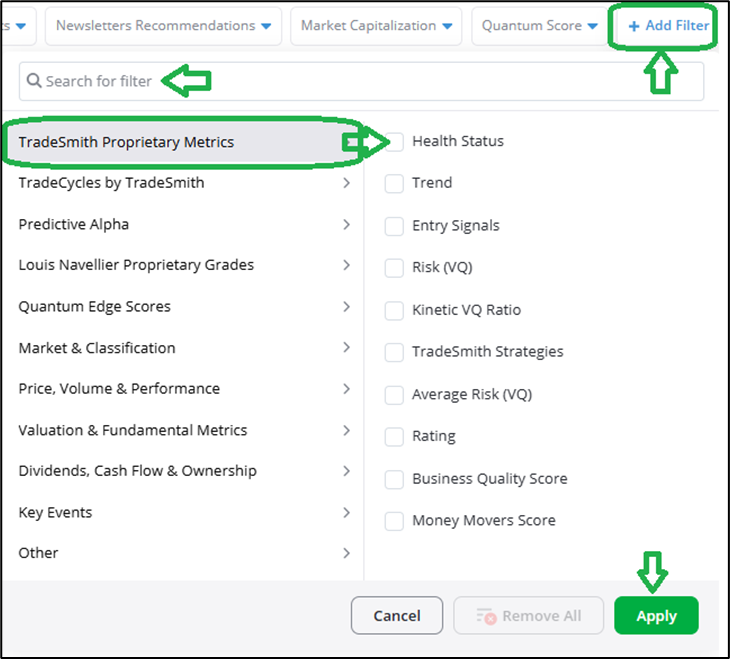
You can also use the Search for filter box to quickly find a particular screen by name.
At the left of the new screener selection tab, all the filter groups you can choose from are listed in order – starting with our familiar TradeSmith Proprietary Metrics.
And the individual filters in each group are displayed at right. Simply click to include the filters you want in your screener.
Now, let’s quickly review each group of filters.
TradeSmith Proprietary Metricsinclude your usual go-to filters like Heath Status, Trend, Risk, and so on – as shown above.
The next four filter groups relate to our special investment strategy indicators. These include:
- TradeCycles
- Predictive Alpha
- Louis Navellier Proprietary Grades
- And Quantum Edge
TradeSmith Platinum members and subscribers to these individual products have full access to these filters, based on their subscription levels.
The next four filter groups relate to mainstream screener inputs:
- Price, Volume, & Performance
- Valuation & Fundamental Metrics
- Dividends, Cash Flow, & Ownership,
- And Key Events
Here’s a few screenshots to show the filters included in each group:
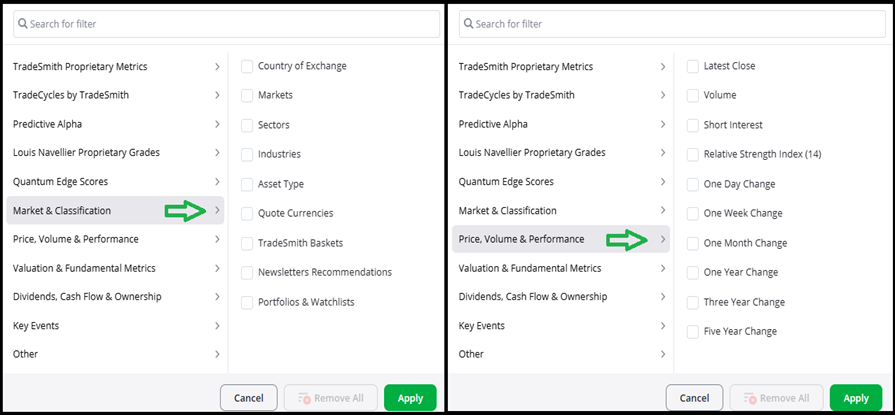
The Market & Classification filter group shown (above left) include many popular and frequently used filters including Markets, Sectors, Asset Type, and more.
In this group you will also find filters to add for our TradeSmith proprietary baskets, Newsletter Recommendations, and your own Portfolios & Watchlists.
The Price, Volume & Performance group (above right) include the frequently used data points you see displayed in most places– including the popular Relative Strength Index (RSI).
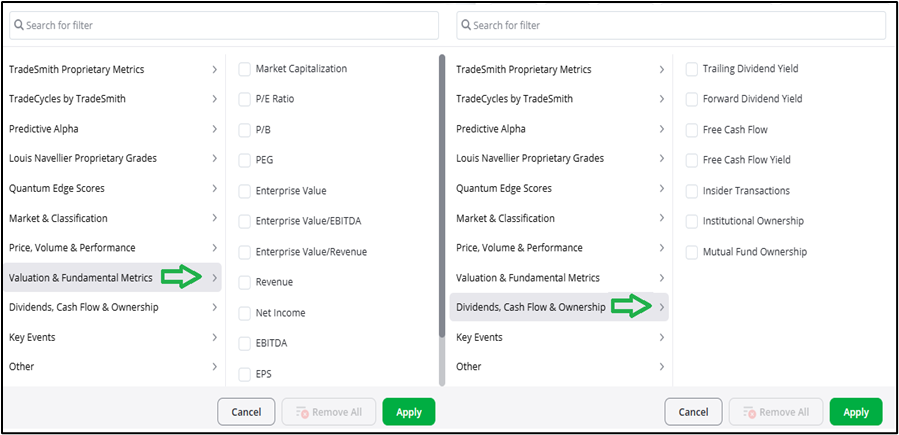
The Valuation & Fundamental Metrics filter group (above left) includes popular fundamental valuation ratios that are often used in earnings analysis. And the Dividends, Cash Flow & Ownership filter group (above right) includes additional financial metrics on dividends and cash flow, plus insider and institutional ownership data.
Finally, the Key Events group contains key corporate events you may want to filter by, including:
- Days to Earnings
- Days to Ex-Dividend Date
- Days to Splits/Spinoffs/Stock Distributions
- And Trading History (days)
Once you select your filters, hit the Run Screener button at top right of the screener page to start your search. Also note that under Display & Sort Results, you can now view up to 1,000 results that match your screener filters, up from 250 previously!
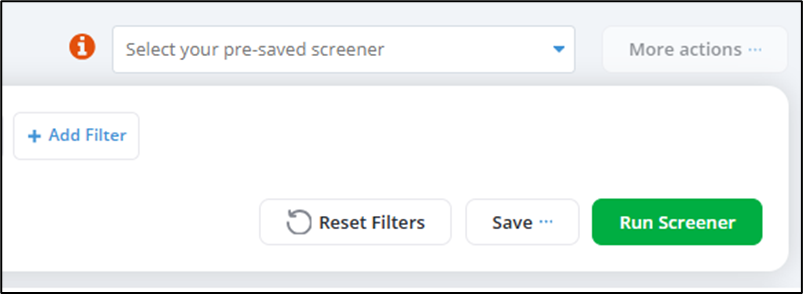
If you want to save your pre-set filters for later, hit the Save button and select “Save as New.”
And if you make a mistake and want to start from scratch, simply click on the Reset Filters button. You can also remove filters from each filter category individually, by clicking on the Remove button in each filter’s dropdown menu.
Finally, the More Actions button allows you to edit your saved screeners and run the Pure Quant Tool (if available with your subscription).
Now, with that test-drive out of the way… here’s a Platinum-level screener I use all the time:

You can easily recreate this for yourself. To add each filter, simply click +Add Filter to begin. And to set up filters to your own specifications, just click the drop-down arrow to the right of each filter to adjust the settings to match my screenshot.
This screen combines several of my favorite screening metrics from many different filter groups, including (from left to right and top to bottom)…
- TradeSmith Health: Healthy stocks in the Green and Yellow Zone
- Business Quality Score (BQS): Our excusive quality rating which includes measures of each stocks’ growth, payout, profitability, and safety fundamentals combined. I set BQS to more than 50 to filter only the top-half of all stocks we rate for quality.
- Markets: S&P 500 large cap stocks
- Free Cash Flow Yield (FCF): My single favorite metric that uncovers stocks with superior cash generation and trading at favorable valuations. I set FCF Yield to more than 5%.
- Trade Cycles: Spotlights key bullish and bearish Seasonal windows for stocks with high odds of historic cycles repeating consistently.
- Days to Seasonality Pattern Start Date: less than 60
- Seasonality Pattern Accuracy Rate: more than 75%
- Predictive Alpha: Proprietary AI-powered algorithm that predicts stock price changes over the next 21 trading days.
- Projected Price Change 1 month: more than 5%
- Quantum Edge: Jason Bodner’s data analytics that tracks Big Money flows likely to move stocks significantly higher.
- Quantum Score: more than 50
In short, this screen is designed to uncover healthy and high-quality, large-cap stocks with strong free cash flow generation. That’s perfect for finding worthwhile opportunities in a market environment deep in the Red Zone.
And since timing is everything when it comes to successful investing, I add an additional TradeSmith exclusive screening layer to zoom in stocks with:
- TradeCycles bullish seasonal patterns starting in the next 60 days or less,
- A Predictive Alpha price forecast for the stock to move up 5% or more in the next 21 trading days,
- And Quantum Edge scores in the top 50%, a combination of solid fundamental and technical metrics, plus all-important money inflows.
Note, you’ll need to subscribe to Trade Cycles, Predictive Alpha, and Quantum Edge to have access to all the screener filters shown above. Or better yet, become a TradeSmith Platinum member: Doing so unlocks full access to all the above and more, including everything we publish – for life.
I call this my “5-Aces” Screener – because it includes inputs from my five favorite TradeSmith Indicators:
- Business Quality
- Free Cash Flow
- Trade Cycles Seasonality
- Predictive Alpha
- Quantum Edge
Here’s an insider tip: If you ever find yourself in a game of high-stakes poker, it’s not a good idea to show five aces in your hand, unless of course the joker is wild!
At any rate, when I ran this screen last week, I got just 20 results. The top five are displayed below, due to space constraints.

Considering the many filters I included in my 5-Aces Screener, it makes sense the results would be somewhat limited. But you can save and run a screen like this on a daily basis – or just once a week – and see fresh results appear all the time.
Also, remember that you can always adjust your filter settings, and use more or fewer filters to narrow or expand your likely results as you see fit.
Take some time to fully explore our newly redesigned Screener page in depth and come up with unique screens all your own. Just don’t forget to save your favorites for future reference!
And if you want an even more detailed visual tour of our new Screener, click here for a video demo led by TradeSmith’s Marina Stroud.
Mike Burnick’s Bottom Line: I personally use the TradeSmith Screenertool more than any other page on our platform. I’m constantly running screens several times a day with different filter combinations, to search out new opportunities and confirm my own investment ideas.
For my money, it’s the quickest and easiest way I’ve ever found to gain a powerful edge in my portfolio without needing to run a supercomputer in my home. As a TradeSmith analyst, I get full Platinum-level access to everything. And believe me, it’s like having hedge-fund level investment analytics at my fingertips!
To learn more about how you can get Platinum-level access and upgrade your membership, call our team at 888-623-0858 to discuss.
Good investing,
Mike Burnick
Senior Analyst, TradeSmith
P.S. My “5-Aces” Screener takes the best research TradeSmith has to offer and puts it into one powerful – and convenient – screen, that I use to find opportunities in the market each and every day. It takes full advantage of my Platinum-level access, but you don’t need to have everything in the TradeSmith toolbox to make the most of the current market volatility.
One of the most powerful parts of my “5-Aces” Screener – and one of TradeSmith’s most powerful tools – is Jason Bodner’s Quantum Edge system.
Long-time Inside TradeSmith readers should be familiar with Jason: He’s our local growth investing expert, and a master of institutional order flow, as well as deep-level market analysis.
His time at Cantor Fitzgerald in the 2000s showed him how Big Money moves markets, and he learned how to spot what qualities in a stock catch the eye of those major market-movers… knowledge he used to help develop his cutting-edge Quantum Score, which uses AI to analyze the market and grade the investment potential of thousands of stocks each week.
Despite the recent market downturn, Jason believes there’s still plenty of opportunity to be found, based on the Quantum Edge system’s analysis: He believes that right now, we’re in a small and very rare window of opportunity – an “Accelerator Window” – where making the right investments now could potentially lead to outsized returns over the next year.
Recently, Jason chatted with Louis Navellier to share his findings in a major broadcast – pulling back the curtains on his powerful Quantum Edge system and highlighting just how this Accelerator Window could give you the chance to grow your portfolio massively… if you move quickly enough.
It’s the kind of scenario that could shave years off your wait for retirement, despite the rocky moves of recent weeks – and Jason has all the details you’ll need to get prepared for it. He’s also picked out five stocks he believes are especially well-positioned for this market moment, and you won’t want to miss your chance at those.
Click HERE to get the details, and find out what Jason’s been working on at Quantum Edge Pro.