Swiftest Declines in Recent Memory: Multiple Markets Now in the Red Zone!
Today was a particularly dramatic day for the stock market: Last week’s tariff trauma has officially gone global.
Last week, we covered the shifting health of the major stock market indexes, in the immediate aftermath of the Trump Administration’s “Liberation Day” tariff announcements.
At the time, most indexes were either in the Health Indicator Green Zone or only just showing caution flags in the Yellow Zone – while the Nasdaq 100 and Russell 2000 indexes were dangerously close to slipping into the Health Indicator Red Zone.
As expected, the nearly unprecedented stock market selloff that ended last week’s trading sessions has stopped out both the Yellow Zone indexes – along with all the other major indexes we track: We now have “Bearseye” signals in place for all indexes, which now sit firmly in the Health Indicator Red Zone… as shown below.
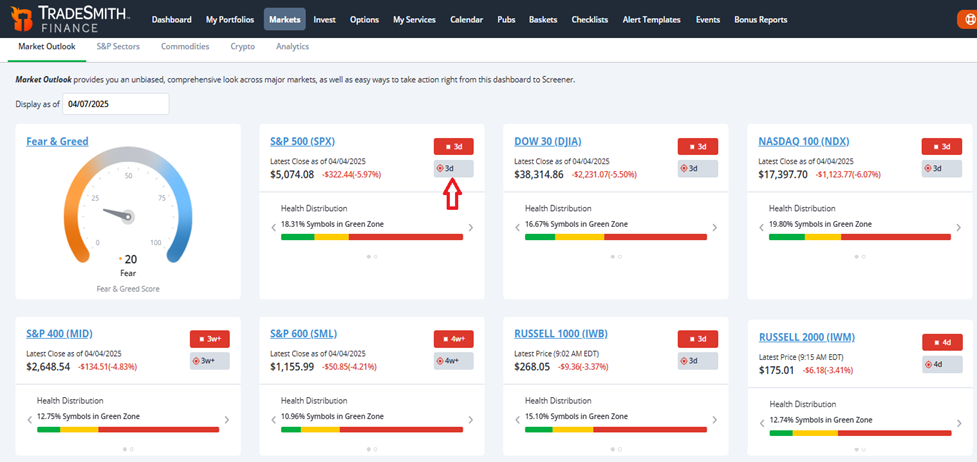
Just to recap, a Bearseye signal is triggered when at least 40% of stocks in a given index have been stopped out, as determined by our TradeSmith trend and volatility indicators (the Stock State Indicators and the Volatility Quotient).
Additionally, the index itself must also be stopped out for these signals to trigger, which happened following Friday’s downside price action.
When Bearseye conditions apply, triggering a fresh signal, watch out: The forecast for that index calls for more downside ahead.
So, what does this mean for investors?
Based on the historical accuracy and timeliness of our TradeSmith Market Outlook signals, the new bear signal suggests that you should strongly consider avoiding any new stock purchases for the time being – unless the stock is in the Health Indicator Green Zone.
Based on analysis of our historical data, we have found that Red Zone stocks exhibit below-average returns with higher risk. If you own any Red Zone stocks in your portfolio, be sure to review those positions immediately – and we suggest you manage these holdings according to our Health Indicator.
You can use the Portfolio Syncing tool to safely analyze your holdings, and use the Risk Rebalancer to find more effective ways to reallocate your funds.
Rapid Declines in Unprecedented Times
The swiftness of the current stock market decline has very few historic precedents – making it difficult to draw parallels and forecast what’s coming next. But when looking at the speed and sharpness of the current movements, the decline that does come to mind is the COVID-19 induced bear market of March 2020.
That entire decline took place over just six weeks. And the damage was severe – with the S&P 500 Index down 35.4% peak to trough:
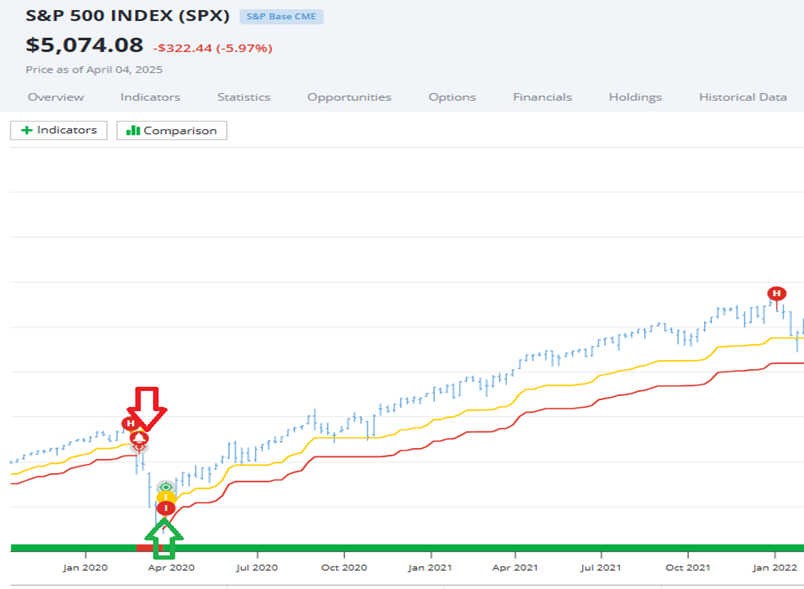
In the chart above, you can see that our Market Health and Market Trend indicators correctly warned of the market decline when the S&P 500 stopped out upon entering the Red Zone on Feb. 27, 2020.
That was also followed by a fresh Entry and Bullseye signal on March 27, just one month later. And following that Bullseye signal, the S&P 500 gained about 90% over the next 18 months.
The lesson here is that it’s best to wait patiently for the dust to settle, and to leave stocks to find their footing again before getting aggressive with your investment strategies.
To underscore the need for patience, consider what has historically happened to the stock market after similar declines like this.
As of Friday’s close, the S&P 500 was down over 15% from a record high, after just 32 trading days. There have been 15 declines of that magnitude since 1929 – this is the 16th. And the data shows that following declines like these, stocks have been higher over the next six months only one-third of the time.
When a lot of damage is done, it takes time to fully repair. Stocks do often see powerful upside moves after severe declines, but they often run out of steam – leading the market to pull back once again.
In fact, historically declines of 15% or more were followed by 13 subsequent declines of 10% or worse at some point over the following three months, compared to just six gains of 10% or more.
Regrettably, that means the odds of a quick recovery are against us, by roughly 2-to-1. So, it pays good dividends to be patient and remain disciplined… and wait for our TradeSmith Market Health and Market Trend signals to improve before jumping back into aggressive positions.
There should be plenty of opportunity for upside gains in the indexes, and in individual stocks, when they return to a healthy state once again. Until then, it’s critical to manage your portfolio responsibly – and keep your wealth safe until the storms clear.
Good investing,
Mike Burnick
Senior Analyst, TradeSmith