Take Full Advantage of Seasonal Sweet Spots with this TradeSmith Screener!
Editor’s Note: On Thursday, we let you know that something big is going down at 10:00 a.m. Eastern on Wednesday, Oct. 15: The next phase of TradeSmith’s legendary Predictive Alpha AI-powered trading algorithm.
Over the past year, TradeSmith’s research team has pushed the algorithm so far beyond its original capabilities that they’re now calling it Super AI.
And with this Super AI comes a brand-new investment vehicle with 85% backtested accuracy and a stunning 374% average annualized return over the past five years.
So, I recommend putting your name on this guest list now – tomorrow morning at 10 a.m. Eastern, TradeSmith’s CEO Keith Kaplan will unveil the Super AI. And there are limited spaces available.
I’ll tell you more about it after we talk seasonality…
Take Full Advantage of Seasonal Sweet Spots with this TradeSmith Screener!
In a recent Inside TradeSmith issue, I gave you a heads up to mark your calendar for the most bullish season of the year.
Specifically, I highlighted the period from late October through December, when stocks have a strong seasonal track record of moving higher. And as we enter the back half of the month, we’re heading straight into that seasonal sweet spot now!
Often, the trigger for this year-end rally period is pulled just after third-quarter earnings reports hit the headlines. That’s especially true when S&P 500 component companies beat estimates – as they have done in spades this year.
But just after earnings, another bullish upside catalyst emerges: Stock buybacks.
As you can see in the chart below, stock buybacks follow a seasonal cadence just like individual markets do. And the rate of those buybacks tends to spike higher after quarterly earnings are reported:
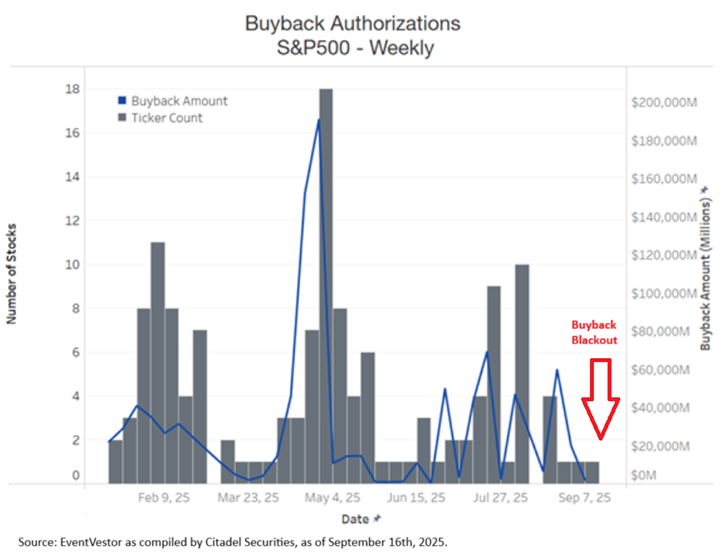
That’s because, per SEC rules, public companies are in a buyback blackout period for several weeks, prior to reporting their financial results. But once the press release is out, they’re free to buy back shares of their own stock again.
And public companies have been doing a lot of that this year.
In fact, companies in the Russell 3000 index have already surpassed $1.2 trillion in authorized buybacks this year. That’s an all-time record pace – amounting to roughly $5.3 billion in daily buying demand. And that rapid buy rate can easily tip the trend to the upside for plenty of stocks – and for the market as a whole.
Meanwhile, many individual stocks have bullish seasonal patterns that appear during the last three months of the year, which coincide nicely with the bullish seasonal trends of the major stock indexes… meaning it’s prime time to search for new bullish trades.
With that in mind, I created a simple TradeSmith Seasonality screener to uncover stocks with bullish seasonal patterns coming up in the next month – just after the peak of earnings reporting season.
Even better, this screener can help you zero in on stocks with the strongest, most consistent seasonal patterns of all, as determined by our Trade Cycles data: Stocks primed to enter Optimal Seasonality periods.
As we worked to upgrade our cutting-edge seasonality tools earlier this year, our analysts and software team did extensive research to find stocks with the most ideal seasonal patterns as well as the highest win rates. Then we analyzed those stocks to quantify the traits of the best possible seasonal windows.
To qualify as an Optimal Seasonality period, the seasonal window must have:
- A historical accuracy rate of 80% or higher…
- An average historical return of 4% or more…
- Annualized return of 20% or greater…
- And at least 15 years of historical data.
So, we’ll let that research guide us: This week, Optimal Seasonality will be the most important of the four simple filters making up this screener.
To get started, log into your TradeSmith Finance account. Once you’re on the platform, simply click on Invest from the main menu bar, then click on Screener in the sub-menu.
Next, click on the blue +Add Filters button and select the following screener filters:
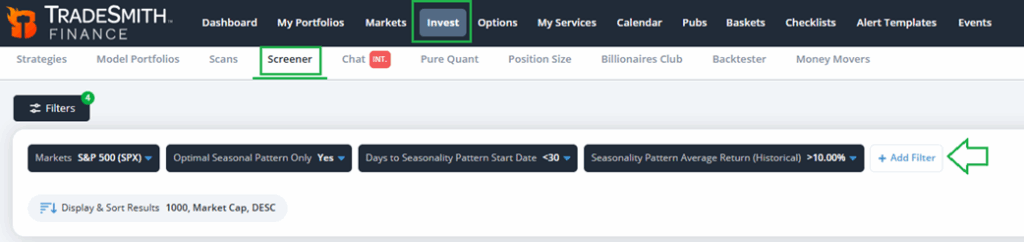
For this screener, I used the following…
- Markets: Under Markets & Classification, select Markets, then from the Markets filter select “S&P 500 (SPX).”
- Optimal Seasonal Pattern Only: Under TradeCycles by TradeSmith, you’ll find this filter – and the next three filters as well. Select this option, and toggle the filter to “Yes.”
- Days to Seasonality Pattern Start Date: I set this at “less than 30 (days)” to capture bullish patterns beginning over the next month.
- Seasonality Pattern Average Return (Historical): Recall that Optimal Seasonal Patterns by default must have historical average returns of 4% or more. But I want to raise the bar here for larger potential gains – so we’ll set this at “More than 10%.”
Members with subscriptions to Trade Cycles and TradeSmith Platinum can access these filters. If you don’t see them (or the TradeSmith Screener tool) in your TradeSmith Finance platform – and you’d like to – give our Customer Care team a call at 888-623-0858 to find out how to get access.
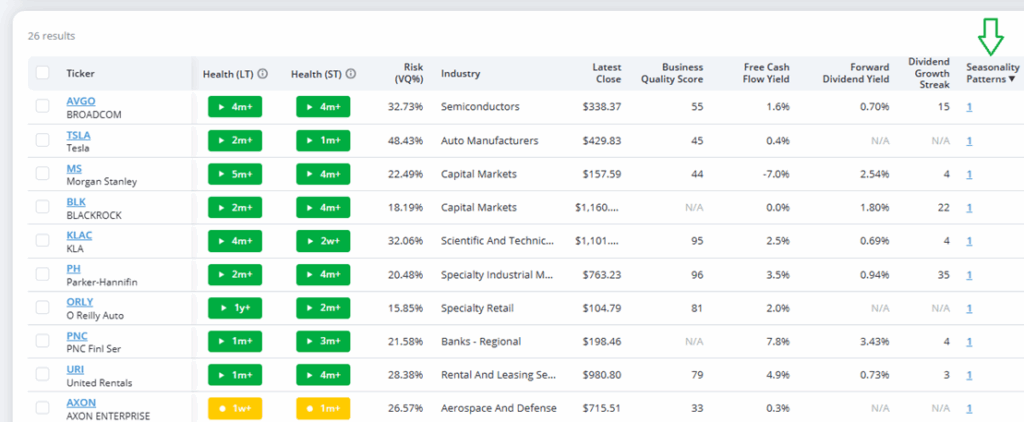
When I ran this screen last week, I got 26 results while scanning just the S&P 500 – with the top 10 results shown below:
However, you could easily change some of the filter parameters to get different results.
For instance, you could add more Markets to your filter, including small-cap and perhaps mid-cap stocks. You could also lower the average historical return somewhat (say to 7%) to get more results.
Plus, you could easily add additional filters for Health, Quality, Fundamentals, or many other proprietary TradeSmith metrics.
Play around with the options and make this screen your own!
Once you’ve gotten your results, focus on the results column labeled Seasonality – and simply click on the highlighted numerals in this column to get more details on the upcoming Optimal Seasonal Patterns for each stock.
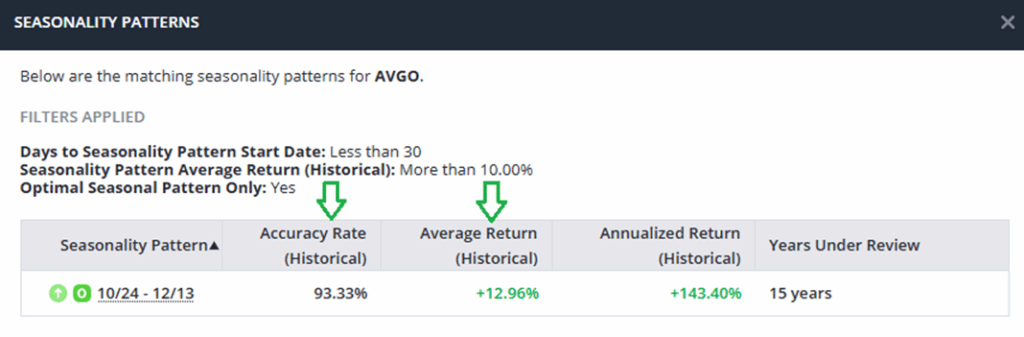
For example, semiconductor blue-chip Broadcom (AVGO) enters an Optimal Seasonality window on Oct. 24, which runs until Dec. 13.
Historically, AVGO shares have risen 93.3% of the time during this period over the last 15 years – while posting average returns of 12.96%!
Mike Burnick’s Bottom Line: Stocks are now in the end-of-year seasonal sweet spot for performance, running from October through December. And should earnings results once again beat estimates in the weeks ahead, this could provide a bigger upside catalyst for stocks.
Combine those market conditions with our proven Trade Cycles Optimal Seasonality indicator, and you can screen for stocks with consistent upside potential in the next few months… or at any time of year.
Good investing,
Mike Burnick
Senior Analyst, TradeSmith
P.S. TradeSmith’s seasonality tools allow us to look back in time and use historical data to identify seasonal sweet spots – periods of the year where stocks and even whole indexes are primed to move. But here at TradeSmith, we aren’t just looking at the past to find our next trades… we’re looking to the future as well.
Now, we haven’t invented time travel just yet – but our latest breakthrough feels just as futuristic. We’re calling it Super AI.
If you’ll look past the funky nickname, this “Super AI” trading tool has captured the attention of every member of Team TradeSmith… because it could revolutionize the way we trade forever.
By using a hyper-accurate algorithm that automatically selects stocks – without the complications of human error or emotion – it could have turned $100,000 into $702,190 over the past year, according to our backtests.
And TOMORROW – on Wednesday, Oct. 15, at 10:00 a.m. Eastern – we’re going public with this breakthrough at The Super AI Trading Event.
For the first time, you’ll see how our Super AI system identifies the five best trades every month – with 85% backtested accuracy. And you’ll learn how you could harness it to multiply your portfolio, even in volatile markets.
Just as AI weather systems can save lives and billions of dollars in damage, our Super AI system is designed to help everyday investors seize opportunities once reserved for Wall Street’s elite.
Because whether it’s forecasting hurricanes… or forecasting markets… AI doesn’t just guess. It knows where the storm is heading.
Seats are limited for The Super AI Trading Event – and tonight’s your last chance to get early access. That includes two free recommendations you can view before they go live to the public… so don’t miss out.