The Options Market is Way Out of Balance
Mega-cap tech stocks are all the rage. That much you know if you’ve been anywhere near a financial headline in the past year (or two, or three…)
But did you know how extreme the bullish speculation has gotten with these stocks’ call options?
The CBOE Put/Call option ratio just hit 75%. This means roughly four put options are being bought for every five call options that trade.
Normally, that ratio is more like 1 to 1. So, calls are outnumbering puts by a pretty wide margin, which means – no surprise – investors are very bullish right now.
This chart below shows that the net call-option volume in the mega-cap growth and technology stocks is now nearly five times the call-option volume in the rest of the S&P 500 stock options:
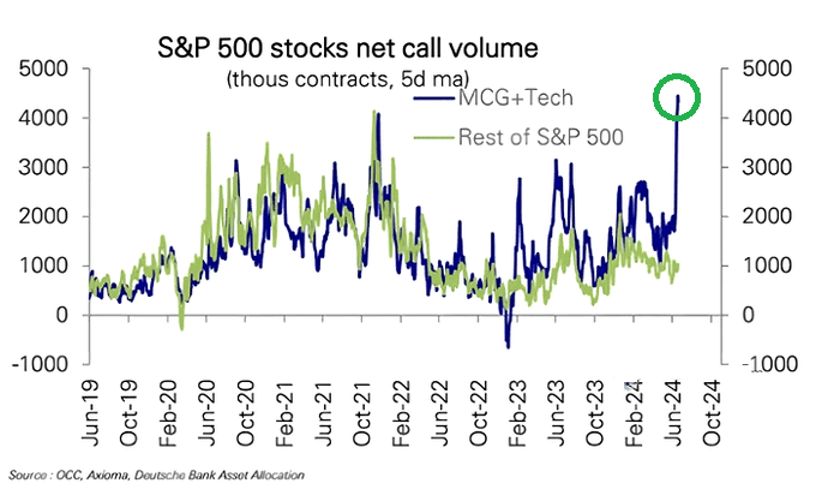
That tells me a lot of speculators are betting big on the likes of Nvidia (NVDA), Microsoft (MSFT), Apple (AAPL), and the rest of the Magnificent 7 stocks. Will those bets pay off? They have been recently, but that’s no guarantee of success.
However, if you’ve been reading my columns for a while now, you know I’m a big fan of non-speculative options trading. Specifically, I like being on the other side of the trade, as a seller of put and call options.
The reason is simple: That’s where the easier money can be made, and that’s where the odds are more stacked in your favor.
When selling cash-secured put options or covered calls, you get:
- Cash upfront from selling the option, and even better …
- A lower risk, high potential reward trade where your odds of success are 80% or better!
Let me show you exactly what I mean.
Last Friday was 17 Paydays in One
One week ago today, I sent an email to a small but quickly growing group of our members. I gave them a reminder that the next day, Friday, they were set to cash in on 17 money-making trades, all put-option sells.
Here is part of that email I sent last Thursday, June 20:
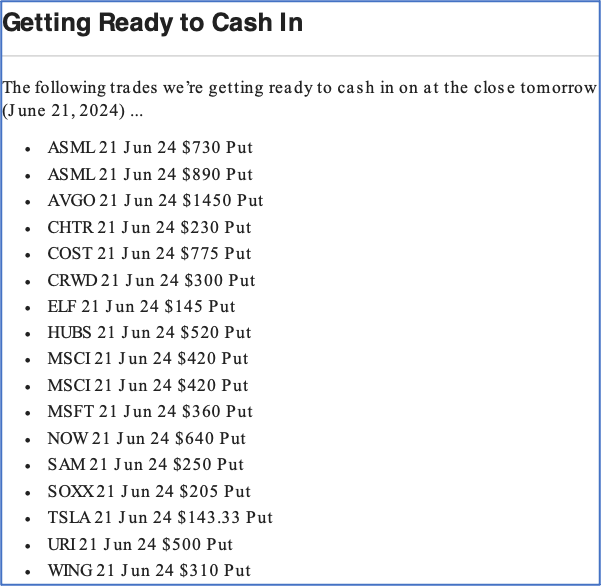
The very next day, we closed all 17 trades as winners.
We’re only six months into the year, but already we’ve had 187 winning trades out of 189 total trades closed this year. Our subscribers get a new income trade every calendar day, usually expiring in the next couple of weeks or month.
And while there were two trades that haven’t gone our way this year, it still adds up to a 99% win rate. It also adds up to $9,735 in total income earned so far this year by this group. And that’s the bare minimum they could have earned from all these trades. Those who had the capital to do multiple contracts would have earned much more.
This growing group are members of our Constant Cash Flow program.
Just over a year ago we began emailing them new income opportunities around noon every single day, including weekends and holidays.
The Daily Trade email includes the exact stock we’re targeting, plus all the trade details to sell a specific put option and instantly earn cash up front, deposited straight to your broker account. Each trade involves selling an out-of-the-money put option with a very high probability of maintaining your profit through expiration.
The picks are provided by our Options360 trading algos and double-checked by my team of expert analysts. If you already subscribe to Constant Cash Flow, Options360, TradeSmith Essentials, or TradeSmith Platinum, then you already have access, and I hope you’re taking full advantage of these money-making daily emails. But if not, simply call us at 888-623-0858 to discuss.
If you’re not yet familiar with these consistent, income-generating trades, I’ll show you just how easy it is to get started.
Let me walk you through an actual past trade of ours. This option is no longer available, but the alert is an example of how taking a few simple steps every day at noon can give you the opportunity to earn thousands of dollars in income.
Here’s How a Constant Cash Flow Trade Works
Below is a Constant Cash Flow email sent a few weeks ago:
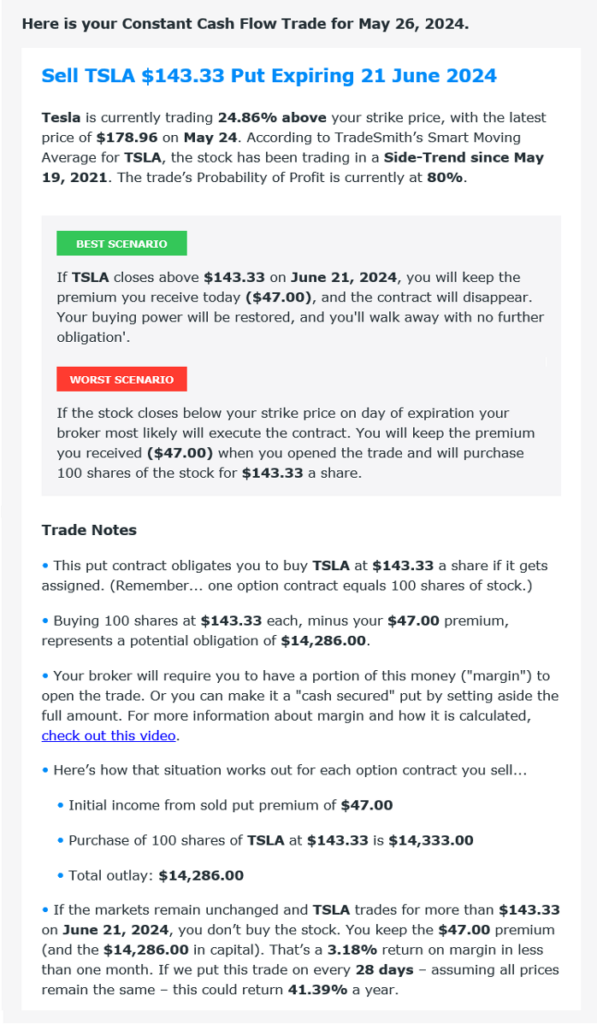
Everything is spelled out in plain English so there’s no guesswork. Right near the top in bold blue highlights is the recommended option trade – in this case:
Sell TSLA $143.33 Put Expiring 21 June 2024
So, this is one of our trades that expired profitably last Friday. Had you gotten this alert in real time, you could have easily found it using the option chain in your online account. Or you could even have called a live broker and simply read this aloud to place the trade.
Scroll down in the email, and you’ll quickly arrive at the most important part: Trade Analytics.

This box and the graph below it tell you everything you need to know about the trade…
- Your high probability of success,
- Your return on investment, and
- How much money you put in your pocket upfront.
It Starts with our Proprietary Probability of Profit
Options360 uses our TradeSmith Probability of Profit (POP) algorithm to sort through thousands of stocks, and tens of thousands of options, to find the handful of put options with the right odds of success.
In this case, an 80% probability of profit. In other words, our algorithm said there was only a 20% chance of this option being in the money on June 21.
Next, the ROI tells you what your Return on Investment will be on the trade. And your actual return is likely much higher than you think at first glance.
Earning $47 of instant income trading in a typical margin account is an ROI of about 3% (also known as return on margin).
But remember, that’s 3% in 26 days (at the time this trade was emailed on May 26). That’s when this option expired.
So, if you placed a similar trade every 30 days, those 3.2% profits add up to a potential 46.4% ROI over one full year!
And for my money, if a picture truly is worth a thousand words, then the underlying asset price forecast graph says it all.
It shows you visually just how high the odds of success are for each trade. Your breakeven price at expiration on the put option is marked with a solid horizontal line in the graph that’s in each alert.
We give you our projected price forecast for the stock as a range shaded in blue, and we mark expiration day with a dotted vertical line.
Our TradeSmith algorithms crunch thousands of data points every day including fundamental and technical data, seasonal trends, and trade cycle patterns for every single stock in our database.
The result is the shaded cone that shows you the most likely price range of the TSLA stock. And, as you saw above, almost none of the shaded area falls below the horizontal line.
In other words, there was very little chance of TSLA trading below the strike price by expiration. That would mean you pocket the $47 premium in less than 30 days, then move your money on to the next Constant Cash Flow trade. And that’s exactly what happened in this TSLA example.
There’s a new one emailed to you every single day … including weekends and holidays. Money never sleeps!
Mike Burnick’s Bottom Line: If you’re looking for a reliable, repeatable way to earn income deposited straight to your brokerage account every single day, then be sure to keep an eye out for Constant Cash Flow. With a 99% win rate on closed trades, the odds of success have been stacked firmly in our favor.
Good investing,

Mike Burnick
Senior Analyst, TradeSmith
P.S. Soon it’ll be what veteran Chicago pit trader Jonathan Rose calls his Rainmaker Season:
“The extraordinary time of year when a $48.5 trillion mega market goes into an absolute frenzy.”
Jonathan spent over 15 years as a professional floor trader before becoming an options market maker as well as educator. He developed his own system for stacking the odds of success in his favor.
And during Rainmaker Season, Jonathan has a history of making a year’s worth of profits in about six weeks. His Super Micro Computer (SMCI) trade alone could have turned $1,500 into $17,400.
Watch this to see how Jonathan does it – he says he’s got a new “rainmaker” trade locked and loaded, ready for you.