Watch Out: 10 Stocks Show Early “Flash Buy” Entry Signals!
Editor’s Note:
Good evening, TradeSmith Insiders – Mike Burnick here.
The TradeSmith offices, including Customer Service, will be closing for the holidays on Friday, Dec. 19. We’ll be back to business as usual on Monday, Jan. 5, 2026 – but in the meanwhile, you will not receive issues of Inside TradeSmith on Dec. 25 and Jan. 1.
We hope you have a wonderful end of the year, and we’re excited to see you again in January!
Ever since we launched our latest enhancements to the TradeSmith Health Indicator a few months ago, we’ve received plenty of questions about how our new Short-Term Health indicator differs from our proven Long-Term Health Indicator.
And more importantly, we’ve received plenty of questions asking how best to take advantage of both indicators together when doing your market research.
So, in today’s issue of Inside TradeSmith, I’ll cover the unique aspects of the Short-Term (ST) Health signals, and how they work in relation to our Long-Term (LT) Health indicator. Plus, I’ll take you on a guided tour to find stocks that are improving in health right now.
Look For “Go!” Signals With The TradeSmith Health Indicator
Let’s begin by reviewing how to find TradeSmith’s health indicators. After logging into your TradeSmith Finance Dashboard, look up the ticker symbol of any stock, ETF, or any other security.
That takes you to the Asset Details page. Next, navigate to the Chart tab at the upper right of the Asset Details page – then click the green Chart Settings button at the far left to open the menu, as shown below:
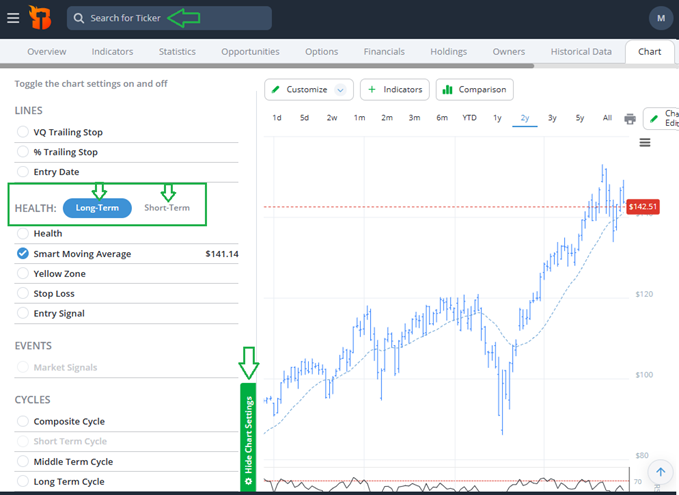
Near the top of the chart settings menu, you’ll find the HEALTH heading: Here, you can toggle between display options for both our established Long-Term Health indicators and the new Short-Term Health signals.
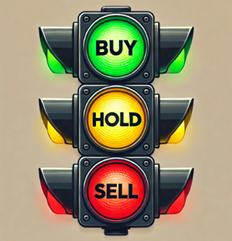
As a refresher, we’ve taken our popular Green-Yellow-Red traffic-light Health Indicator system and created a new version geared for shorter term trading and investing.
I covered the fine details of our Short-Term Health Indicator system in an earlier issue, if you want to catch up.
But in a nutshell, the biggest difference between these two TradeSmith Health indicators comes down to timing.
Our Long-Term Health Indicator is based on a longer period of price and volatility data, and the signals it generates are designed for holding periods of 12 months of more.
The new Short-Term Health Indicator, on the other hand, is based on six months of price and volatility data – and is designed to produce more frequent, timely signals.
To get a visual of the difference, check out the graph below:
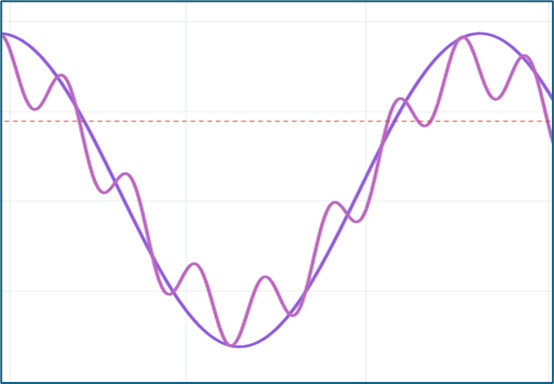
Within any longer-term trend, up or down, you’ll also find short-term trends nestled in between the long-term peaks and valleys.
Our LT Health indicator helps you stay invested with the long-term trend. And as a long-term signal, this indicator ignores some of the short-term noise to focus on the bigger-picture signals.
Meanwhile, the ST Health indicator helps you take advantage of the short zigs and zags within the trend, from a trading perspective rather than an investing perspective.
Our extensive research and backtesting of the Short-Term Health indicator tells us:
- ST Green signals trigger on a healthy upward trend that may persist for about two months on average. Stocks in the S&P 500 gained an average of 13.7% while in a ST Health Green state.
- ST Yellow signals last about two weeks on average and mark a transitional stage between bullish and bearish conditions. S&P 500 stocks gained an average of 1.5% on this signal, basically neutral.
- ST Red signals trigger on unhealthy downtrends that may persist for two months on average. S&P 500 stocks lost an average of -4.3% when in a ST Health Red state.
So, you can see that the Short-Term Health indicator is a useful tool for more active investors or traders who may want to take advantage of momentum swings in the markets or individual stocks.
You can think of these signals as “Flash Buy,” “Flash Hold,” and “Flash Sell” signals – notices to move quickly, as a stock moves over the next few weeks.
Let’s take a look at these signals in action, using the SPDR Technology Sector ETF (XLK).
From your TradeSmith Finance Dashboard, simply type the symbol, XLK, into the Search for Ticker bar at the top of the page to get started. Then, from the Asset Details page, click on the Chart tab at upper right…

Next, select the green Chart Settings button at far left.
Finally, under the HEALTH heading, click on the Long-Term button to see the Long-Term Health signals for XLK:
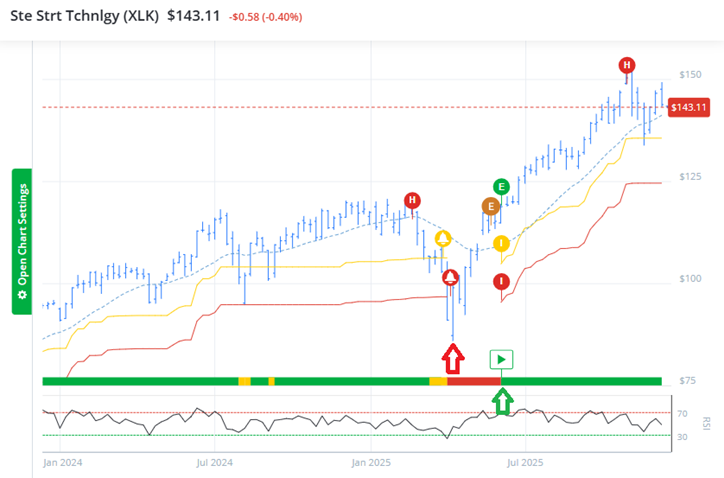
Let’s take a trip back in time by a few months, going back to the tariff-trauma selloff in stocks we saw during April.
- Our LT Health indicator for XLK slipped into the Yellow Zone on March 27, giving you an early caution signal warning about potential trouble…
- Then, XLK entered the LT Health Red Zone on April 4…
- And then, after a few weeks of stabilizing, XLK moved higher – and on June 3, the ticker triggered a signal placing it in the LT Health Green Zone once again.
Now, click on the Short-Term button under the HEALTH heading, and you’ll see how these signals on XLK were more timely, and more useful to the reactive trader:
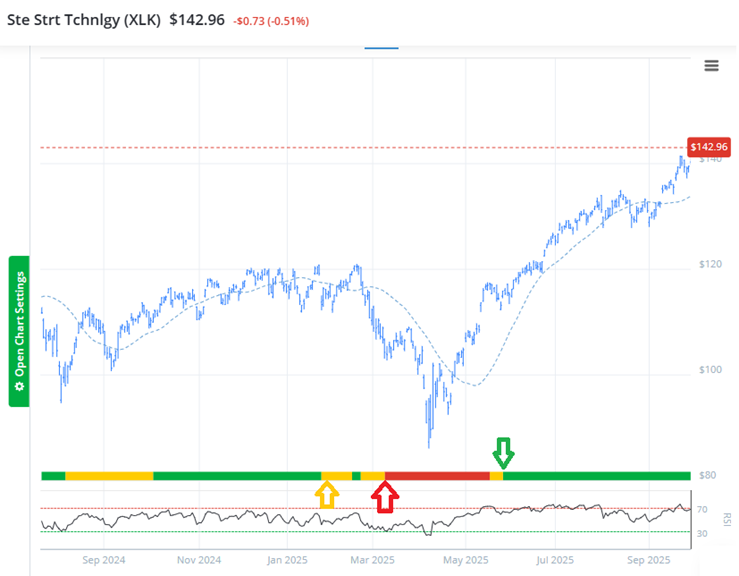
- Here, XLK entered the ST Health Yellow Zone earlier, on Jan. 27. That signal provided an early caution notice, well ahead of the tariff trauma.
- XLK then entered the ST Health Red Zone on March 10, providing an earlier and timelier exit signal.
- By May 16, XLK was back in the ST Health Yellow Zone, transitioning back into a healthy state. And by May 27, XLK triggered a ST Health Green Zone signal again.
So, for more active traders and short-term investors, the ST Health indicator is designed to be timelier, perhaps flashing multiple signals during extended LT trends.
This can help you get out of harm’s way quicker, and back into a security a bit sooner, providing a little extra juice in terms of profit potential.
ST Health can be used as a standalone indicator as an early exit or entry signal, and in combination with the LT Health indicator as well.
For example, to get an early jump on long-term trend changes, consider buying a security when the LT Health is still in the Red or Yellow Zone, but after the ST Health indicator has already signaled a Green Zone entry.
With that idea in mind, I ran this screen yesterday:
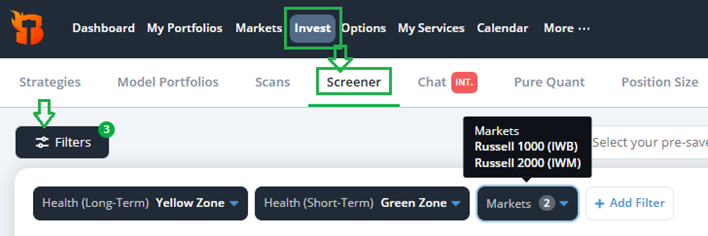
This includes just three filters:Health (Long-Term) and Health (Short-Term),along with Markets. I set the Markets filter to search for stocks in both the Russell 1000 (large-) and Russell 2000 (small-cap) indexes.
When I ran the screen yesterday, I got only 10 results, shown below:

It’s not unusual to only have a few results with this screen.
That’s because when the stock market is behaving normally, with typical volatility, the Short-Term and Long-Term Health indicators will generally be in sync.
But when trends suddenly shift, like they did earlier this year, that’s when you may find a lot more divergence between the two Health indicators.
Notice that all the stocks in our results list above are in the LT Health Yellow Zone… But that each of those stocks have also recently turned Green according to the ST Health indicator.
In fact, a few of these stocks just turned ST Green within the past few weeks!
These could be good early buy candidates for traders or shorter-term swing traders.
Bottom Line: The new Short-Term Health indicator complements our tried and trusty Long-Term Health indicator, and shares the same Green-Yellow-Red traffic light warning system. But while the Long-Term Health indicator is well-equipped for entering and exiting longer-term investments, the Short-Term Health indicator provides you with an earlier reading on the health of any asset in our database.
Using both these Health indicators in combination, for instance in a TradeSmith Screener, can alert traders and investors to new buying opportunities in a flash!
Good investing,
Mike Burnick
Senior Analyst, TradeSmith
P.S. TradeSmith’s Long-Term and Short-Term Health Indicators are incredible tools: When combined, our Green-Yellow-Red alert system can help any investor or trader find ideal entry and exit points. And these days, having that advance notice is critical.
Markets are moving faster than ever, and they’ve also become more concentrated than ever: Just a handful of stocks drive most of the movement in the S&P 500, and between the algorithms that drive most of today’s trading… the retail market’s endless hunger for options contracts… and an increase in investor anxiety over federal policy…
Well, it feels like we’re one or two bad days away from another market-wide shock.
TradeSmith’s Health Indicators are a great defense against these sudden downturns, as we saw earlier this year. But we’re always looking to improve – and we’ve been hard at work preparing our tools for the worst-case scenario… and figuring out how to identify the best time to pull away from the market, ahead of the next big decline.
To answer that, TradeSmith has teamed up with one of Wall Street’s most respected investors – and we’ve combined our cutting-edge investment software with that same investor’s hedge fund-favored market indicators.
Earlier today, TradeSmith CEO Keith Kaplan went live to discuss the dangers hiding beneath the surface of the market – and more importantly, to share the innovative solution our team has spent the past year building to help you navigate it.
Keith has been spearheading the development of these “flash-buy” and “flash-sell” signals for months now, and what he’s uncovered through that process is critical for every investor who wants to protect their gains as we move into 2026.
In fact, the early-warning system he debuted today could be the single most important improvement we’ve ever made to our investment technology… as we’re getting some of the same warning signs we saw before the 2022 crash and the Liberation Day downturn earlier this year.
If you haven’t seen it already, click HERE to check out Keith’s announcement. You won’t want to miss it.