Your Sixth “Lesson” In TradeSmith: Turning Main Street Buzz Into Wall Street Bargains
The mighty American consumer contributes roughly 70% of the growth in our economy.
And even though the concentrations of that consumption are changing – with fewer consumers doing more of the overall spending – the contributions to the economy are not.
That’s why the ebb and flow of consumer spending patterns are one of the most important factors driving both economic activity and stock market performance.
Here at TradeSmith, we’ve made it our mission to provide everyday investors with hedge fund-level tools and data. As we discussed earlier this week, our new Signals by TradeSmithtools scan thousands of stocks to flag the highest-probability setups for potentially winning trades, all based on stock behaviors.
But there are some setups and trades you can’t find by looking at stock data…
We’ve found that by closely examining consumer tastes – the products and services that people buy, recommend and talk about online – you can get an edge in predicting what stocks are likely to outperform the overall market.
In today’s issue of Inside TradeSmith, we’re returning to our “TradeSmith 101” series by taking a walk down Main Street, as we measure the buzz for products and services – which often translates into bullish stock moves on Wall Street!
Grading Main Street Buzz With TradeSmith’s Social Heat Scores
Tracking consumer sentiment and spending preference is tricky business. You can’t just base your findings off of Google searches and a few Reddit threads… and you have to find ways to weigh trending hashtags and viral Facebook posts against each other on top of that.
Frankly, the idea of sorting through all of that makes me dizzy!
That’s why I leave it to our resident experts, TradeSmith Analysts Andy and Landon Swan – the brothers behind MegaTrends, and the inventors of our Social Heat Scores.
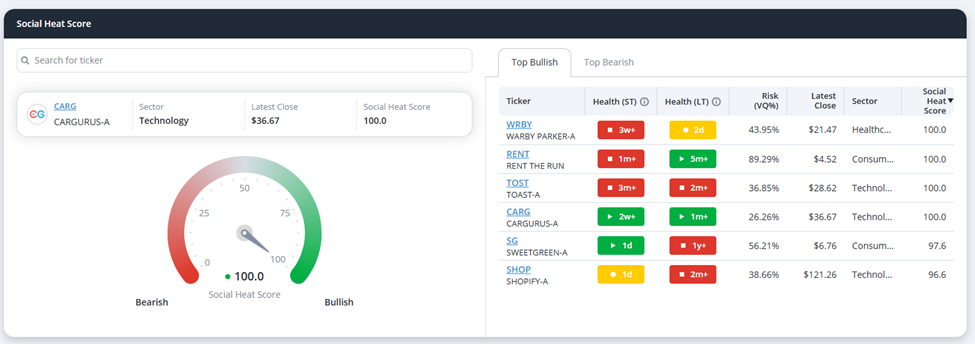
Members with subscriptions to TradeSmith Platinum, MegaTrends, and Earnings Season Pass can easily view Social Heat scores for hundreds of different stocks, all from the comfort of their TradeSmith Finance Dashboard.
Simply log in to your platform and scroll down the page to find the window shown above, and you’ll be sitting at your gateway to real-time consumer sentiment insights.
From here, you can search for your favorite stock by ticker symbol at the upper left, or you can view the current Top Bullish and Bearish Social Heat Scores at the upper right.
Either way, you’ll be presented with these exclusive TradeSmith metrics, powered by our cutting-edge analysis of live social media trends.
The Social Heat Scores help you quickly uncover potential market moving stock opportunities, by evaluating four key types of online consumer engagement data:
- Brand Mentions (Buzz): Discussion of any brand, product, or service linked to a specific company…
- Positive Sentiment: Online posts that show satisfaction or enthusiasm…
- Negative Sentiment: Negative posts that show criticism of products and services…
- And Purchase Intent: Posts where people say they’ve bought or plan to buy a product/service.
It’s all carefully distilled into the Social Heat Score – a single, easy-to-read number from 0 to 100 that reflects how a brand, product, or service is resonating with consumers down on Main Street.
When Social Heat Scores rise and consumers get buzzing about a company, it can often lead to a bullish reaction – and when scores drop substantially, it can signal bearishness ahead.
The Swan brothers have found that this buzzing most often occurs before Wall Street analysts catch on, and well before the stock reacts… giving you an opportunity to get in ahead of time.
How we Measure Social Media Buzz
To calculate our Social Heat Scores, we tap into real-time social media data across the internet, from platforms like X (formerly Twitter), Reddit, Google, and more.
From there, our systems track how consumers “vote with their wallets” for and against thousands of brands and companies.
Every social media post is processed by advanced technology that measures brand-name excitement, cross-referenced with a database of over 11,000 brands from over 425 different companies. It then uses that data to produce meaningful signals, using thousands of predictive keywords.
Let’s take a look at the Social Heat Score for Toast (TOST) and see how this works in practice:
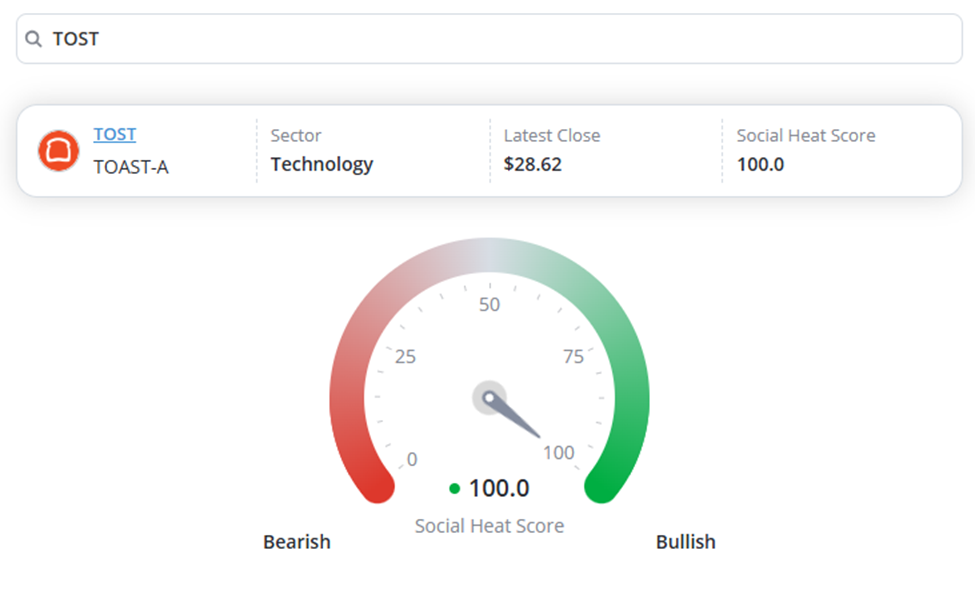
Toast produces point of sale hardware and software for hospitality companies – most commonly restaurants. And clearly their customers love the product and service.
At time of writing, the company merits a perfect Social Heat Score of 100. It doesn’t get much better than that!
And with TOST up about 8% over the last month, that high score could lead to further bullish moves in the near future. Especially with the company set to report earnings next week on Thursday, May 7, I’ll be sure to keep the stock on my watchlist.
Your Season Pass to Potential Earnings Profits
And speaking of earnings… Andy & Landon Swan took their cutting-edge Social Heat Scores to an even higher level by adding a key catalyst.
We all know that earnings results move stocks – and entire markets.
So, they created another incredible tool to empower everyday investors.
Earnings Season Pass harnesses the power of consumer insights to predict when a stock’s earnings results are likely to meet, beat, or miss Wall Street forecasts – using the same high-tech analysis behind the Social Heat Scores to find an edge during the most volatile periods of the trading year.
Armed with this valuable data, Earnings Season Pass gives you a clearer picture of which direction a stock is likely to move during earnings reporting season.
Members with subscriptions to Earnings Season Passand TradeSmith Platinum can also access the new Earnings Season Pass Interactive Scorecard from their TradeSmith Finance Dashboard.
During each quarterly earnings season, you can check this tool every week to find valuable calendar-based data on stocks likely to have positive or negative earnings surprises:
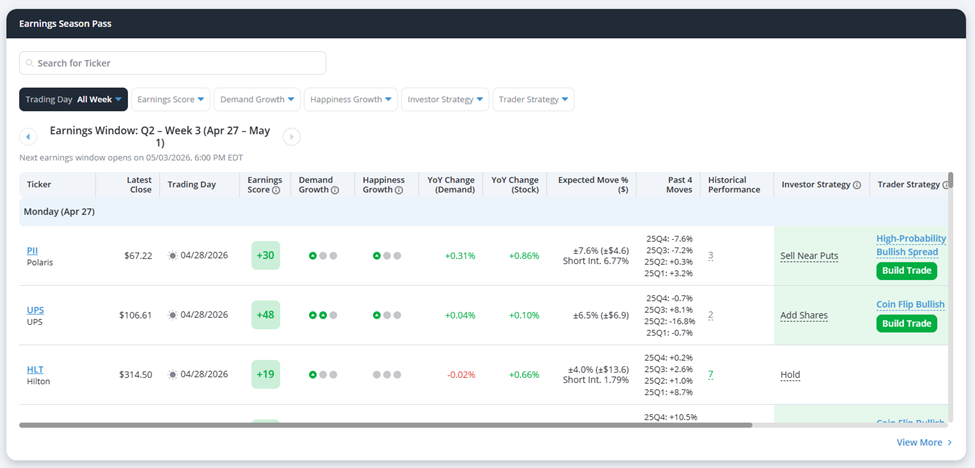
Simply scroll down the scorecard to find every stock we track with a Social Heat Score that is reporting earnings results over the next week.
And to make things easier, you can even scan for your preferred earnings season trades by clicking on the filters shown just above This Week’s Earnings Window, to sort based on Trading Day, Demand Growth, Trader Strategies, and more.
You can also change the Earnings Window using the left or right arrows to see earnings results from past weeks, or review upcoming reports in future weeks.
The Earnings Season Pass data includes the insights you need to evaluate the stock’s potential reaction post-earnings.
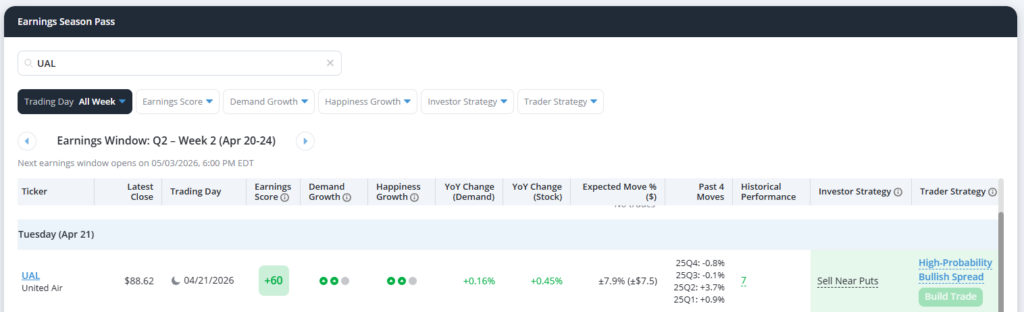
Above is the detailed view of United Airlines (UAL) from last week – just before it posted results.
Earnings Season Pass gave UAL a very bullish +60 Earnings Score, and suggested specific strategies to profit. This high-probability trade setup on UAL resulted in a 22% profit!
All the key details needed to evaluate each potential earnings trade is displayed for you here, including earnings announcement dates, historical performance results, and three key metrics designed by the Swan brothers:
- The Earnings Score (higher is better), ranking how bullish or bearish the system is on the report,
- The Demand Growth, based on how much consumers want the product or service,
- And the Happiness Growth, based on how pleased consumers are by the company.
At far right of the window, you’ll also find the Investor or Trader Strategy recommended by the system, to give you the best chance to potentially profit from earnings season moves.
Investors can quickly add or reduce shares of stock in anticipation of a potential earning beat or miss, and Traders can take advantage by selling or buying put and call options on the stock.
You can even build your own trade quickly and easily using options spreads by simply clicking on the Build Trade tab.
Mike Burnick’s Bottom Line: By harnessing the power of social media data, the Swan brothers created TradeSmith’s unique Social Heat Scores – all to provide investors like you with insights on stocks with growing popularity. These insights give you an edge over Wall Street, allowing you to find new opportunities well before big money investors buy in.
Earnings Season Pass translates this data into more immediate profit opportunities by predicting whether a stock will beat, meet, or miss Wall Street expectations during each quarterly earnings season. And with regular analysis and trade recommendations from the Swans, it’s one of the best ways to approach the volatility of earnings season by my money.
And with Q1 earnings already driving stock prices higher – and lower – now’s the perfect time to get involved and start working with this cutting-edge system.
Click here to learn more about Earnings Season Pass – and how you can put it to work immediately.
Good investing,

Mike Burnick
Senior Analyst, TradeSmith