Crisis-Proof Your Portfolio
We all remember it like it was yesterday.
Schools were shut down, and kids had to learn from home on laptops…
Offices had gone empty and silent…
And grocery delivery services we had never heard of before were as frequently used as our emails or banking apps.
While this now feels like a distant and somewhat bizarre memory, the COVID-19 pandemic is the most recent crisis that every last one of us experienced – and even if you were not directly affected by health issues, most of us felt the effect in our wallets.
Just look at this comparison of the CBOE Volatility Index (VIX) from the 2008 financial crisis to the COVID crash of 2020 – the spikes are not too far off:
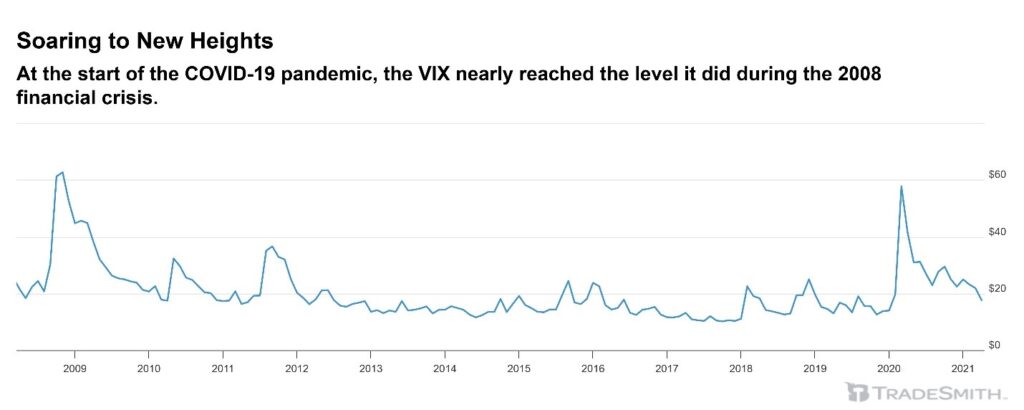
As quickly as the pandemic panic selling came, it did not take terribly long for prices to recover – but by then, for many investors, the damage was done.
They had sold everything as it was crashing, taking on loss after loss that could only be described as financially catastrophic.
And when conditions began to improve and stocks began to tear higher and higher… investors were left with a fraction of the capital they started with – and no way to know when to buy, when to sell, when to hold, or what to do.
Preventing that outcome is one of the biggest missions we have here at TradeSmith: For the everyday investor to never feel that level of uncertainty.
We are not perfect here – there is no magic investment tool that will flawlessly prevent you from ever experiencing a single loss…
But we do have a way to “crisis-proof” your investments – enabling you to know when to pump the gas or hit the brakes, how big of a swing in a stock’s price you can expect as “normal,” and how to properly allocate risk levels across your portfolio.
Allow me to share a real-life example…
Those investors that I talked about during the COVID crash that panic-sold and lost tons of cash? I could have been one of them.
But TradeSmith’s proprietary Volatility Quotient (VQ%) – as discussed in The Volatility Mastery Blueprint – gave me a clear exit signal before the worst of the decline. I moved most of my capital to the sidelines and protected my portfolio from the S&P’s 24% loss:
But here’s where it gets interesting.
Just one month later, on March 27, the Health Indicator (recall our Green-Yellow-Red system from The 30-Minute Portfolio Transformation) turned green on select stocks. One week after that, the market surged 12% in five trading days — the best week for stocks in 46 years.
Because I had preserved my capital and followed some of the re-entry signals, I had the chance to capture this explosive upside. Stocks like Novavax (NVAX), which the Health Indicator identified with a green light, could’ve delivered gains as high as 1,000%.
Now imagine the combined power of all three mechanisms working in perfect harmony:
- The VQ% helps you decide when to exit any position…
- The Risk Rebalancer ensures you have the right amount invested in each opportunity…
- And the Health Indicator signals when to re-enter after volatility subsides.
This is where wealth building reaches an entirely new level.
In this report, we are going to talk about the three pillars to steeling your portfolio against the next market correction – and the exact steps you can take today to do so.
But before we dive in, let’s see this approach in action…
Before & After: Portfolio Transformation Under Stress
Here are two example portfolios:
Portfolio A starts with $100,000.
- It takes too much risk in volatile positions and drops 40% in a market correction to $60,000.
- Even with a strong 30% recovery afterward, it only gets back to $78,000.
Portfolio B also starts with $100,000.
- But with risk rebalancing, proper position sizing, and intelligent position calibration, it only drops 15% to $85,000 during the same correction.
- With the same 30% recovery, it grows to $110,500 – not just recovering, but reaching a new high!

See how that works?
Now, let me show you what happens when we combine these powerful mechanisms, intelligent position calibration, and the VQ%.
These aren’t hypotheticals – these are real-world portfolios that demonstrate the transformative impact of these mathematical principles working together.
Here’s our first example: A $225,000 portfolio that would have lost 28.9% of its value with traditional investing approaches. That’s a devastating loss of nearly $65,000.
Now watch what happens when we apply just Intelligent Position Calibration. Instead of losing $65,000, this portfolio would have preserved capital with a slight 0.7% gain – that’s a $66,000 difference from making one mathematical adjustment.
But here’s where the magic happens. When we combine both the VQ% exit strategy and Intelligent Position Calibration, this same portfolio would’ve delivered a remarkable 44.1% return – turning $225,000 into over $324,000. That’s a $99,225 improvement from the original approach!

As you can see, separating the tools works… just OK.
But if you really want to set yourself up for success, combining our three pillars is the best way to go.
The Three Pillars of Crisis-Proof Investing
Before we dive into how to fully crisis-proof your portfolio, recall two of the three pillars of a successful portfolio that we discussed in your other reports, The Volatility Mastery Blueprint and The 30-Minute Portfolio Transformation…
Pillar No. 1: The VQ% System
At TradeSmith, we know that an exit plan is more critical than your entry plan. You’d never drive a car without its brakes, so it makes sense that you should never enter into an investment without knowing when to “stop.”
The Volatility Quotient (VQ%) does exactly that for you. By analyzing a stock’s unique movements over the past three years (with the past year’s data more heavily weighted), the VQ% identifies how risky an asset is – by way of identifying it as low, medium, high, or sky-high risk.
From there, a percentage is calculated, and by using an asset’s most recent high close price, you can calculate its customized trailing stop. Because the truth is, the traditional 15-25% trailing stop is not one-size-fits-all; some investments need tighter trailing stops, and others need wide trailing stops.
But we’ve got it all figured out for you.
And where VQ% acts as your brakes, the Health Indicator acts as your traffic light…
Pillar No. 2: The Health Indicator
Like the traffic light at an intersection, TradeSmith’s proprietary Green-Yellow-Red Health Indicator shows you, at a glance, the vitality of a given asset.
- Green is your “Go!” signal. It indicates an asset is at its strongest and healthiest state, and it has risen significantly off a major bottom, is performing well, and is experiencing only minor corrections.
- Yellow is your “Wait” or “Slow Down” signal. It indicates an asset has sustained a significant correction but is still moving within the boundaries of its expected volatility.
- Finally, Red is your “Stop!” signal. It indicates an asset has corrected more than it should have based on its expected volatility, and it is no longer “healthy.”
The Health Indicator updates regularly, so you never have to guess if one of your investments has hit an unhealthy state.
The Green-Yellow-Red system – especially Yellow and Red – works alongside the VQ% to show you if a stock is experiencing a natural pullback… or if something more serious is going on, and it’s time to plan your exit.
These two tools work well on their own, but when it comes to ensuring your portfolio is weighted equally – i.e., you don’t have too much money in a high-risk position and not enough cash in a low-risk one – you will want to know how much of what kind of position to buy.
So, here’s your third and final pillar…
Pillar No. 3: Intelligent Position Calibration
This pillar actually contains two parts:
- Asset allocation…
- And position sizing.
These two work together as one invaluable tool, but talk about the specific benefits of each…
Asset Allocation
People love to learn about interesting stocks with huge potential.
The mainstream financial media constantly reports on individual companies and their stock prices.
However, when it comes to lasting investment success, asset allocation is 100 times more important than stock picking.
Asset allocation is the part of your investment strategy that dictates how much of your money you place in diversified asset classes like stocks, real estate, cash, bonds, commodities, gold, and other financial vehicles.
Over the course of your career as an investor, asset allocation will have a much greater impact on your wealth than stock picking will ever have.
Since many individual investors spend their time studying and investing in individual stocks, they don’t spend any time learning what sensible asset allocation is.
This leads them to take crazy risks with their retirement savings.
Intelligent asset allocation is like having a “balanced investment diet.” Ideally, you want a diversified mix of assets that greatly limits your exposure to a big decline in one asset class.
Intelligent asset allocation means you don’t bet the farm on a single stock or a single asset class.
For example, there’s the story about the catastrophic losses suffered by Enron employees.
In the late 1990s, Enron was considered the world’s most innovative company. Its executives were the superstars of corporate America. So, some Enron employees placed all their retirement savings in Enron stock.
Their asset allocation was “100% Enron.”
When Enron was revealed as one of the biggest frauds in American history, its stock went to zero. The employees who bet the farm on Enron were completely wiped out.
These people used incredibly risky asset allocation.
Or consider Americans who went “all in” on real estate in 2005 and 2006.
Back then, real estate mania was in full force. Real estate was considered a “can’t lose” bet. Many people put all their savings into real estate – and even took on loads of debt to “leverage” their returns.
When the real estate market crashed, these “all-in” real estate players were wiped out.
At the heart of their downfall was an absolutely crazy asset allocation. They bet the farm on one asset class – and it was in a bubble.
If you keep a huge portion of your wealth in a single asset class – whether it’s stocks, bonds, oil, gold, real estate, or whatever else – you leave yourself exposed to a large decline in the value of that asset class.
You make yourself financially “fragile” – exposed to what happens with just one business, one stock market, or one asset class.
Given the big risks that going “all in” on one stock or one asset class presents, it makes great sense to diversify your wealth.
Think of it like eating a balanced diet.
You want to include options from different food groups. Taken together, a mix of things helps you achieve maximum health.
This works because some assets “zig” when stocks “zag.”
According to the investment bank Credit Suisse, U.S. stocks have returned an average of about 10% per year for the past 120 years.
This average return beats gold, oil, bonds, cash, and every other widely traded financial asset on the market.
Stocks produce excellent long-term returns for a simple reason: The U.S. system of free enterprise leads to tremendous wealth creation. It gives life to value-creating businesses like Ford, Home Depot, and Coca-Cola.
Free markets create goods and services that people want to buy – and wealth follows. Investors go along for the ride.
Given the stock market’s long track record of success, it’s no wonder many people are interested in stocks.
However, the high returns you can earn in stocks come with a tradeoff. Stocks are more volatile than bonds and many other assets. From time to time, stocks experience big declines in value (aka “bear markets”).
For example, during the 2000-2002 bursting of the technology stock bubble, the benchmark S&P 500 index declined by 49%.
Then you have the bear market that accompanied the Great Recession of 2007-2008.
Stocks fell an incredible 56% during the decline.
These two recent examples show that while generating excellent long-term gains, stocks can inflict serious short-term pain.
That risk is more than many people are comfortable taking on.
And no crisis-proof “hardened” portfolio should decline in value by 56%.
Fortunately for investors again, some assets “zig” when stocks “zag.”
They do well even when the stock market is struggling.
There’s rental real estate. There’s farmland. There’s timberland. There’s gold and government bonds.
There are municipal bonds and corporate bonds. There’s cash, commodities, collectibles, and currencies.
There’s private business.
And, of course, there’s cryptocurrency, like Bitcoin.
Different economic climates affect the price of these assets differently.
For example, in 2007, stocks began to decline in advance of the Great Recession.
- As the crisis began to take hold, stocks fell throughout 2007, 2008, and 2009. The broad market fell 57.7% from its 2007 high to its 2009 low.
- During that terrible period for stocks, gold – which is traditionally a “safe-haven” asset – gained 31.8%.
- During the same rough period for stocks, government bonds – another traditional safe haven – climbed about 18%.
Or consider what happened during the 2000-2002 bursting of the tech bubble and the subsequent bear market in stocks:
- During this brutal time for investors – where technology stocks lost more than 70% of their value – corporate bonds returned 9.3% in 2000; 7.8% in 2001; and 12.1% in 2002.
- Real estate also did well during the tech meltdown.
- The S&P Case-Shiller U.S. National Home Price Index increased 27% from Jan. 1, 2000, through the end of 2002.
You see these kinds of divergent returns across asset classes over and over throughout history.
Because different economic climates affect different businesses and asset classes differently, some assets “zig” when stocks “zag.”
That’s why an investor focused on building wealth and maintaining it will own a diversified mix of assets.
To be clear, like the Volatility Quotient (VQ%), there’s no “one-size-fits-all” asset allocation strategy that is right for everyone.
When you (possibly with the help of a financial advisor) think about your right “mix,” you must consider your age, your risk tolerance, and your goals.
- A 45-year-old who wants to pay college tuition for three children will think about asset allocation much differently than a 28-year-old with no kids.
- And a 28-year-old with no kids will think about asset allocation differently than a retired 75-year-old.
Whatever asset allocation mix you choose, just make sure you’re not at risk of being wiped out by a crash in a single business or asset class.
This will ensure your financial life is built on a strong foundation and can increase your odds of achieving total financial freedom.
And combining that with the second part of Pillar No. 3 will increase it even more…
Position Sizing
As we talked about with the Position Size Calculator, many investors approach buying stocks on a 1:1 basis – they’ll buy the same amount of low-risk stocks as they do high-risk stocks.
You know by now that that does not work, but here is why…
Most of us have been there – you learn about a company with major growth potential.
The upside is more than 500%. So, you buy a lot of the stock. You want to truly capitalize on the opportunity.
And then, things don’t work out.
The company doesn’t execute. Instead of its market value soaring 500%, its market value falls 50%. You’ve lost way more money than you were comfortable losing (which could have been avoided with the VQ%-recommended trailing stop…).
It’s an embarrassing and painful experience, but this is where smart position sizing comes in.
It’s the great preventer of unacceptably large financial losses.
Position sizing is the part of your investment strategy that dictates how much of your investable assets you will place into any investment or trade.
For example, suppose an investor has a $500,000 net worth:
- If this investor buys $5,000 worth of a business, his position size would be 1% of his total capital.
- If the investor buys $50,000 worth of the business, his position size is 10% of his total capital.
- If the investor buys $200,000 worth of the business, his position size is 40% of his total capital.
Many folks think of position size in terms of how many shares they own of a particular stock or investment.
But a smart investor thinks in terms of what percentage of her net worth is in a particular holding.
Position sizing is one of the most important ways you can protect yourself from what is known as a “catastrophic loss.”
A catastrophic loss is the kind of loss that erases a huge chunk of your net worth.
It’s the kind of loss that ends careers and ruins retirements.
- Most catastrophic losses occur when an investor takes a much larger position size than he should.
- He’ll find a stock he’s really excited about. He starts dreaming of the potential profits, and then he makes a huge bet.
- He’ll place 20%, 30%, 40% or even 100% of his account in that one idea.
- He’ll “swing for the fences” and buy 2,000 shares of a stock instead of a more sensible 300 shares.
When the investment doesn’t work out… it is a catastrophic financial loss. Think of an investor who starts with $100,000 and suffers a catastrophic 80% loss – he is left with only $20,000.
It takes most people years to make back that kind of money. But the less obvious, indirect damage is often worse than losing money; it’s the mental trauma of taking such a huge loss and feeling like a failure.
Some people never recover from it. They see years of hard work and savings flushed down the toilet.
But most world-class investors say that you should never put more than 10% of your account into any one position. Some professionals won’t put more than 5% in one position. Seasoned investors vary their position sizes depending on the particular investment.
For example, when buying a safe, cheap dividend stock, a position size of up to 3% may be suitable.
Some managers who have done a lot of homework on a stock and believe the risk of a significant drop is tiny will even go as high as 10% or 20% – but that’s more risk than the average person should take on.
If you’re investing money into a startup business, a speculative stock, an option position, or anything else that is on the riskier end of the spectrum, the answer to “How much could I lose if this goes badly?” is usually, “Every single dollar.”
That’s why speculative situations are best played with tiny amounts of your capital. (Recall that 86.08% VQ% for Carvana from The Volatility Mastery Blueprint.)
Or if you’re a conservative investor, not played at all.
But let’s say you’re buying a speculative biotech stock or a speculative tech company with just one potential “big hit” product.
With speculative investments, there is always the possibility that you could lose 100% of your money. So, you want to use a tiny position size.
Generally, you don’t want to place more than 0.5% or 1% of your net worth into a speculative investment.
That way, if the situation works out badly, you only lose a little bit of money.
You certainly don’t want to put 5% or 10% or 25% of your net worth into a speculative investment. It’s way too risky.
Unfortunately, most novices will risk three, five, or 10 times as much as they should in speculative investments.
It’s a recipe for disaster.
If the investment doesn’t work out as planned or if the broad stock market suffers a big correction, a big position in a speculative investment can cause a big hit to a person’s overall wealth.
When in doubt, always dial down your position size.
It will help you follow Warren Buffett’s most important rule: Don’t lose money. And it will help you avoid catastrophic losses.
When you start as an investor or trader, you’re as bad as you’re going to get.
So take legendary trader Bruce Kovner’s advice and “under trade, under trade, under trade.”
Make much smaller investments than your emotions want you to make so you can get the hang of things.
If you have $10,000 to get started as an active investor, set aside $7,000 in cash and only invest with $3,000 for the first six or 12 months.
But even after going through a training period like this, it’s tough to learn not to lose money unless you actually feel the pain of losing a lot of money.
In summary: If you want to build your investment portfolio on a strong foundation, you must learn how to win big by betting small.
Focus on using smart position sizing to avoid the catastrophic loss.
Focus on limiting your downside, and the upside practically takes care of itself.
The Crisis Preparation Checklist: Actions to Take Now
You have all the tools…
You have the Volatility Quotient (VQ%). You have the Health Indicator and Position Size Calculator. And now you have intelligent position calibration, by way of proper asset allocation and position sizing.
The next obvious question is… well, now what?
We’ve got you covered. Here are four steps you can take today to make sure your portfolio is prepared for the next market surge… or correction.
✅ Step 1: Sync Your Portfolio
We advised it in both The Volatility Mastery Blueprint and The 30-Minute Portfolio Transformation: syncing your portfolio to TradeSmith Finance puts all of your investments in one place.
You can learn how to do so in this easy-to-follow guide here.
✅ Step 2: Audit Your Portfolio
Now that your positions are all in one clean spread, you can use the Health Indicator to check the viability of your positions and the VQ% to identify the risk level.
If a stock has a sky-high risk level and is in the red, it may be time to sell.
If a stock has a medium risk level and is happily in the green, that is a signal of a healthy, solid stock.
Now, you have to choose what you’re willing to risk – and for how long.
✅ Step 3: Rebalance Your Risk
Head to the Unbalanced Positions tab on your Analyze Portfolio page to see if any of your positions are under- or overweighted. From there, you can see if anything needs to be changed to optimize your holdings and reduce your chance of catastrophic loss.
✅ Step 4: Set Up Alerts
For extra protection – and an easy finger on the pulse of your investments – you can add portfolio alerts for these VQ%-determined trailing stops.
These alerts will come as an email notification or push notification (if you’ve downloaded the TradeSmith app), and while the alerts will not take any action on your brokerage account, they’ll let you know that it is time to take action and protect your investments.
✅ BONUS STEP: Email Us!
You can contact your Customer Concierge Team with any questions Monday through Friday, 9 a.m. to 5 p.m. ET at [email protected].
To your success,
Keith Kaplan
CEO, TradeSmith