

Here at TradeSmith, our software development team is always hard at work to create new additions and improve our impressive array of analytic tools and market indicators.
Just within the past year, we’ve made several major expansions, including…
- Improving our powerful Artificial Intelligence (AI)-driven Predictive Alpha indicators…
- Introducing Jason Bodner’s Quantum Edge scores…
- And enhancing our Trade Cycles Seasonality tools with Seasonal Edge.
These headline upgrades to the TradeSmith software suite give members like you the kinds of powerful tools that, until now, only professional money managers and hedge funds had access to.
Any of these tools on their own can help you become a more successful trader or long-term investor… and after 35-plus years in this business myself, I can tell you for a fact that these tools have even helped make me a better investor.
In these Inside TradeSmith columns, I often cover the advantages of these tools and indicators by themselves… but by combining them, you can really ramp up your trading or investing power.
That’s an inquiry I get all the time from Inside TradeSmith readers: how to make the most of multiple TradeSmith tools in tandem. And today, I’ll walk you through a simple method to do so, all with a template you can create in just a few minutes.
Let’s get started.
How to Put Customized Hedge-Fund-Level Analytics at Your Fingertips
Just last week, TradeSmith Platinum member Gary G. wrote in to share an earnings season success story: By combining analysis from the Swan brothers over at Derby City Insights, two of the newest members of Team TradeSmith, with our tried and tested Trade Cycles Seasonality tools, Gary was able to identify a promising call option trade on Stride Inc. (LRN) – netting a 67% gain in just a few days.
While all of TradeSmith’s research, tools, and indicators can bring success as standalone resources – as plenty of our successful members can attest – one of my all-time favorite ways to dig down and find high-quality trades (or to confirm trades I’m considering based on other data) is to combine a selection of our tools into a market-sleuthing super-strategy… just like Gary did.
And it’s not a difficult tool to craft, either: We can build a Platinum-tier TradeSmith Screener in just a few minutes, and pack it with as many of our TradeSmith tools and analytics as we’d like.
To build one of these super-screeners for yourself, start by logging in to TradeSmith Finance. From your Dashboard, click on Invest at the top of the page, then select the Screener tab to load up our trusty TradeSmith Screener tool.
Once you’ve loaded the Screener tab, click the blue + Add Filter button at the top right of the window to start creating your new custom screener – featuring a combination of our most powerful analytic filters:
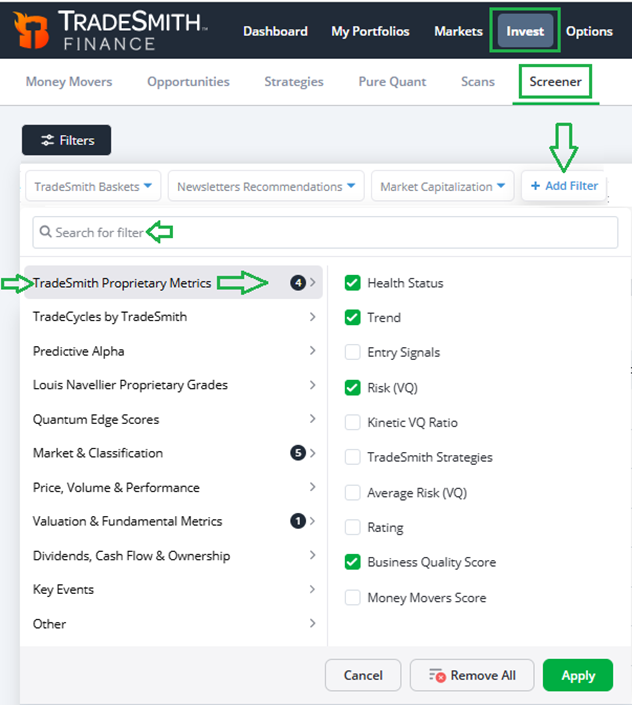
From the Add Filter menu, we can use the search bar or click through the various groups to add as many options as we’d like: just click the checkbox next to a filter to add it to your Screener.
And let’s start at the top with some of our proven TradeSmith Proprietary Metrics, including…
- Health Status: We’ll search for stocks in the Green & Yellow Zones to find stocks in a healthy state according to data from the TradeSmith Health Indicator.
- Trend: By selecting Up and/or Sideways trends, we can avoid down-trend stocks and go long.
- Risk (VQ): By setting our proprietary volatility quotient to < 40%, we can filter for only medium to low-risk stocks that are stable in today’s volatile market.
- Business Quality Score: By setting this filter to > 50, we’ll look only at the top half of stocks ranked by quality by our TradeSmith analytics.
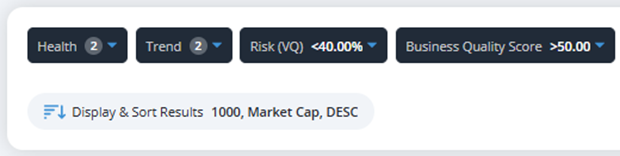
This combination of filters will zero in on healthy stocks with positive or neutral trends that are relatively low-risk while still getting high marks for business quality (a combination of growth, payout, profitability, and safety fundamentals).
It’s a great foundation of key attributes to look for in stocks at any time, but especially in volatile, uncertain markets like today’s.
From here, you can add any combination of filters and indicators you have access to – with the specifics based on your personal subscription level. But to take advantage of the Platinum-level access I have, today I’m going to add a selection of my favorite TradeSmith indicators, pulled from a variety of our services.
Now, let’s move on to our exclusive Trade Cycles Seasonality indicators for the next set of filters:
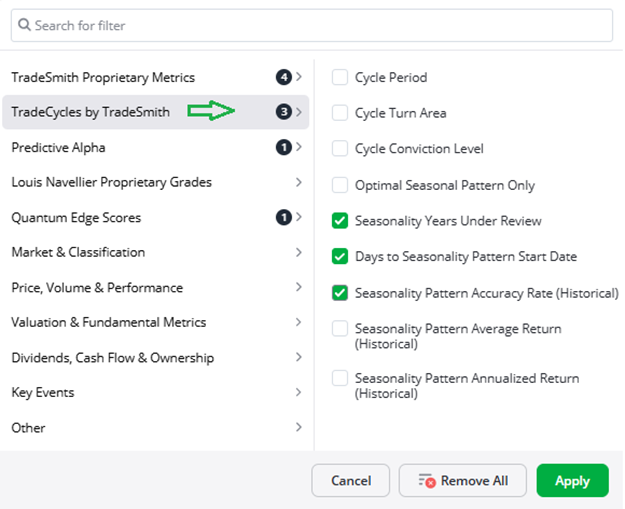
- Seasonality Years Under Review: Set to 15 Years or more.
- Days to Seasonality Pattern Start Date: Set to < 45 days.
- Seasonality Pattern Accuracy Rate (Historical): Set to > 70%.

These Seasonality indicators can help you uncover stocks with consistent seasonal patterns that tend to repeat year after year. Here, we’re looking for seasonal windows over the past 15 years or more that open within the next 45 days and have greater than 70% historical accuracy.
Next, let’s add our AI-driven Predictive Alpha stock price projections:
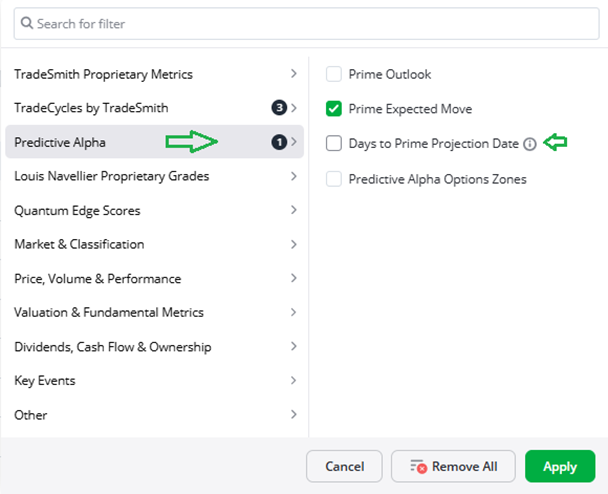
- Prime Expected Move: Set to > 5%.
Our Predictive Alpha indicator makes AI-powered price forecast projections anywhere from one day to about one month (21 trading days) into the future. I set this filter to search for moves of +5% of greater.
Finally, let’s add an extra bit of spice to our Platinum-level screener, with the Quantum Score:
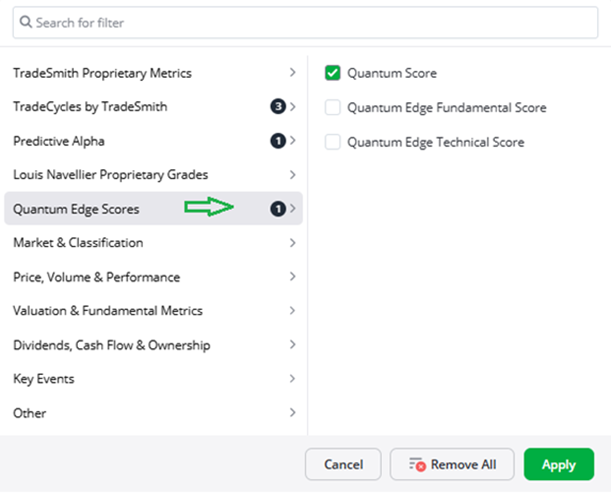
- Jason Bodner’s Quantum Score: Set to > 50.
Jason’s Quantum Score is a combination of his technical and fundamental indicators, plus the all-important element of Big Money (institutions and hedge funds) flowing into (or out of) a given stock.
Jason’s “sweet spot” for buying new positions is a Quantum Score of 70 to 85, but we’ll cast a slightly wider net (>50) to catch more results.
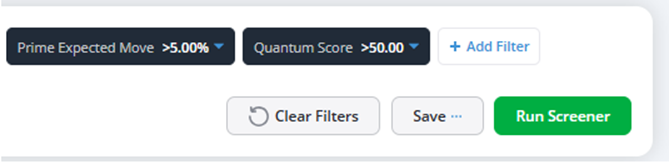
Now, before viewing the results of this super-screener, let’s take a step back to look at the big picture of the masterpiece we’re painting here.
With these filters, we’re combining:
- Our proven TradeSmith Health, Trend, Risk and Quality metrics – to find healthy, stable stocks positioned to rise…
- Our powerful Trade Cycles Seasonality tools – to find potential bullish seasonal patterns coming up over the next 45 days that could give our new position a timely lift…
- Predictive Alpha’s short-term price projections – to hunt for stocks predicted to rise 5% or more over the next 1 to 21 days…
- And Jason’s proven Quantum Scores – to find stocks on the right side of big money flows.
Essentially, we’re taking our foundational TradeSmith metrics to identify winnings stocks, then we’re adding the important element of trade timing by adding Trade Cycles Seasonality data.
Next, we’re enhancing our supporting data with insights from our AI-powered Predictive Alpha short-term price projections.
And finally, we’re adding the key factor of big money flows with the Quantum Score to find big money support that could send our position moving higher.
These filters are all based on somewhat different data inputs and analytical methods. But in combination, they all point in the same direction for these stocks: UP!
For my money, this gives me a much higher conviction level when it comes to identifying potential winning trades – when multiple TradeSmith indicators agree, I’m inclined to pay attention.
When I ran this screen, I got 31 results:
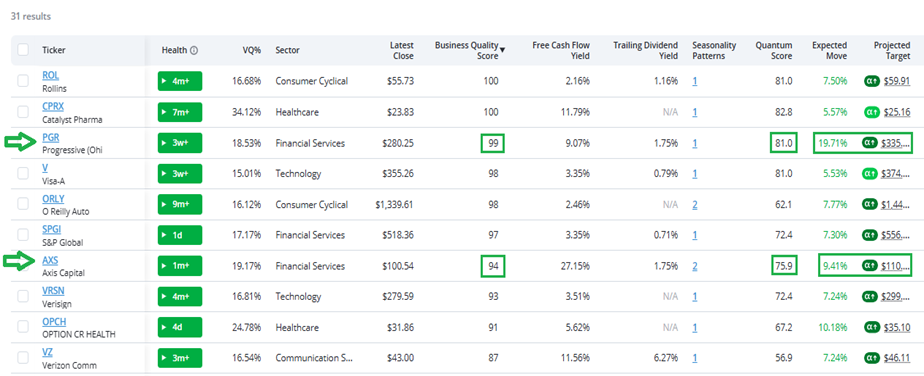
Let’s take a look at a sample of stocks that made the cut.
One stock that stands out to me is Progressive (PGR), the big insurance firm. It has an outstanding Business Quality Score (BQS) of 99 out of 100, and a Quantum Score of 81 – right in the sweet spot.
And if we simply click on the number link highlighted under the Seasonal Patterns column, we can see details on the seasonality patterns identified by our Trade Cycles tools, as shown below:
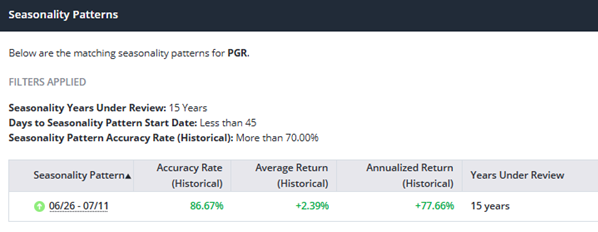
PGR has a bullish seasonal pattern starting June 26 and ending July 11, with a historical accuracy rate of 86.67%… and the period has delivered +2.39% average returns historically, too. That makes for an annualized return of +77.66% over 15 years!
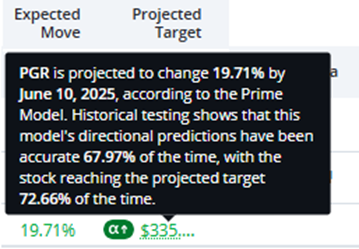
Finally, our Predictive Alpha system expects PGR to move up 19.71% – to a projected $335 a share – by June 10. You can get those details by hovering your mouse over the Projected Target column.
Another interesting stock from the list is Axis Capital (AXS), which also gets very high marks from multiple TradeSmith indicator filters.
As always, you can adjust your own filters or even add more filters as you see fit, to really make this screener your own. That way you can get a larger and more inclusive, or a smaller and more focused list of results based on your own investing preferences.
Another good tip about making this your own screener: Sort the list multiple ways to get a different picture from different perspectives.
You might sort by Predictive Alpha Expected Move, to see stocks sorted by those projected to move up the most. Or you sort by Quantum Score to find stocks with scores in the sweet spot.
Once you’re satisfied with the results, be sure to click on Save As New and give it a name. That way, you can return to the screener again and again for new results.
Also, if you click on the checkmark box at upper left of the results, you can save the results as a new portfolio or basket using the dropdown menu. That means you can monitor these stocks as you do further research on each. Plus, you can set alerts that will tell you if they’re on the move.
Mike Burnick’s Bottom Line: There’s no limit to the many ways you can mix and match the various filters and indicators on your TradeSmith platform. These are high-level data analytics available right on your PC (or in the palm of your hand, via our mobile app) – and the best part is that these analytic tools are fully customizable, with no limits other than your imagination.
You can set the filters you choose to get the results you want, find what works best for you, and make it your own.
Good investing,
Mike Burnick
Senior Analyst, TradeSmith
P.S. The Screener we built today uses my favorite TradeSmith indicators to find stable, high-quality stocks that are primed for growth – but you can take this same screener template to build your own super-screener to find new investment ideas or confirm ideas you’re considering from elsewhere.
But to get easy access to all of the proven analytic data, market indicators, and TradeSmith screener filters we used today – and then some – you’ll need a subscription to TradeSmith Essentials… or my own personal recommendation, TradeSmith Platinum.
For my money, the Platinum level of access is well worth it. We’re talking about hedge-fund level analytics, all at your fingertips – enhanced with research and market insights from analysts across TradeSmith.
Just a few winning trades over the next year can easily pay for this VIP membership, and thanks to the major upgrades we’ve rolled out to TradeSmith over the last few months, we’ve made finding those trades easier than ever.
Earlier this year, TradeSmith CEO Keith Kaplan went live to deliver The Big Reveal – a blockbuster event where he shared the latest news and developments coming to TradeSmith.
In his presentation, Keith covered the latest tools, product launches, and system upgrades coming down the pipeline – all designed to give you even more control over your investments. And to sweeten things even further, Keith announced the addition of a few new world-class analysts who are joining our dream team of market experts. You’ve already heard about two of them today: Andy and Landon Swan over at Derby City Analytics.
During the event, Keith also unveiled an extraordinary anniversary offer, giving attendees access to premium products like Seasonal Edge and Predictive Alpha.
It’s a chance to get access to the full breadth of TradeSmith tools and data… and it’s a chance you won’t want to miss.
Don’t miss your chance to see what’s new: get the full details from Keith now.