

The stock market has been trending lower recently – and we’re not out of the woods just yet.
As I’ve pointed out in recent issues, technology stocks have sat at the center of the latest major selloff… and over the last few weeks, the sector has taken a real beating.
In fact, the Invesco QQQ ETF (QQQ), which tracks the tech-heavy Nasdaq 100 Index, has fallen over 15% since early October. And last week’s drama surrounding the former CEO of Nvidia certainly hasn’t helped.
But could this be a hidden opportunity to buy the dip in big tech?
A TradeSmith Signals Study I just ran suggests that it could very well could be.
But before we get to that high probability rebound opportunity… let me give you a bit of background.
Signals by TradeSmith is one of our latest major developments: It’s a cutting-edge trading system that analyzes hundreds of stocks every day, using hedge fund-level analytics to uncover hidden trading patterns that you can turn into potential profits!
Now, for those unfamiliar with the basic idea, a “signal” is simply a pattern or a set of conditions that have shown up many times before in certain stocks. When these signals appear, these stocks typically move in a predictable way in the days or weeks to follow.
Our Signals algorithms run through almost 200 possible entry rules – and dozens of potential exit rules – when scanning stocks on the market every trading day. That adds up to more than two million potential trade assessments every year.
And when certain conditions align, Signals flags the patterns on our dedicated Signals Dashboard, so you can review them at a glance – and act on them to enter trades with the odds in your favor.
But one of the most unique parts about the Signals software suite is our exclusive Signals Study tool.
Dig Deep Into Market Moves With Signals Studies!
Subscribers with access to Signals by TradeSmith can access this powerful tool on TradeSmith Finance with just a few clicks. Start by selecting Signals from the main menu, then click the Signal Studies tab in the sub menu bar, as shown below:

On this page, you can build your own Signals studies from scratch. And just like with the TradeSmith Screener tool, you can customize your search as you see fit, by choosing between a wide variety of technical indicators like price action, volume, volatility and much more…
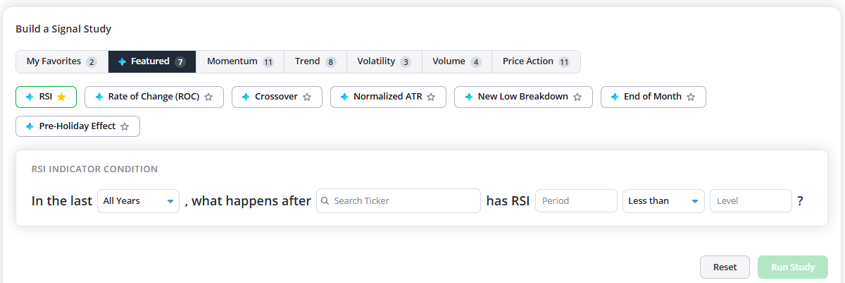
You’ll notice several categories of Signal Studies available on this page, including:
- My Favorites, where you can build & save your own signal studies…
- Featured,a category including several of our popular, pre-built studies…
- Momentum, which has technical indicators like RSI, Rate of Change (ROC), and Stochastics…
- Trend, which includes our proven Health indicators plus moving average crossovers…
- Volatility, featuring our TradeSmith Volatility Quotient (VQ)…
- Volume, with money flow indicators like the Chaikin Oscillator and Money Flow Index…
- And Price Action, where you can build studies based on large price moves like gaps up or down.
These building block categories allow you to easily create your own custom indicator conditions, all allowing you to analyze how a particular stock, ETF or other asset has historically performed under that same set of conditions.
The best way to illustrate the power of Signal Studies is by walking you through a simple study I recently ran myself.
Spoiler alert: The results could mean good news for the Nasdaq 100 ETF (QQQ).
So, let’s dive into my own study…
The first step was to select a category. I chose Volume, then selected the Money Flow Index (MFI), a technical indicator that measures the flow of money in and out an asset over a specific period of time:
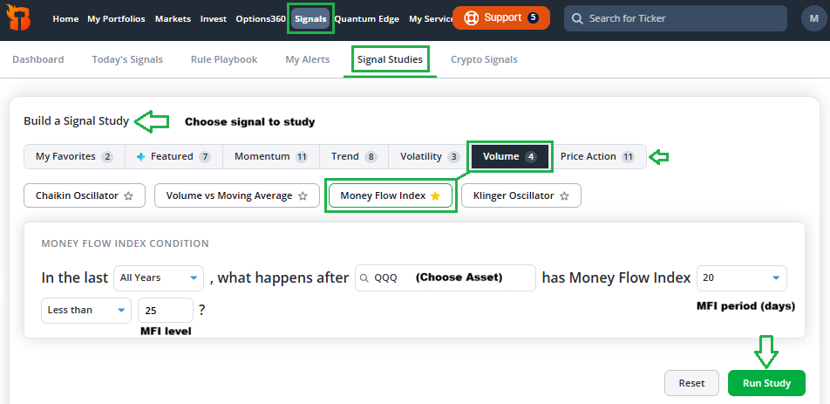
The Money Flow Index is similar to the Relative Strength Index (RSI). But unlike RSI, MFI combines trading volume with price action to give you a more complete picture of an asset’s momentum.
MFI helps to gauge the strength of buying power or selling pressure and identify overbought or oversold levels. And with the Nasdaq down so much over the past month, the MFI can signal if it’s oversold.
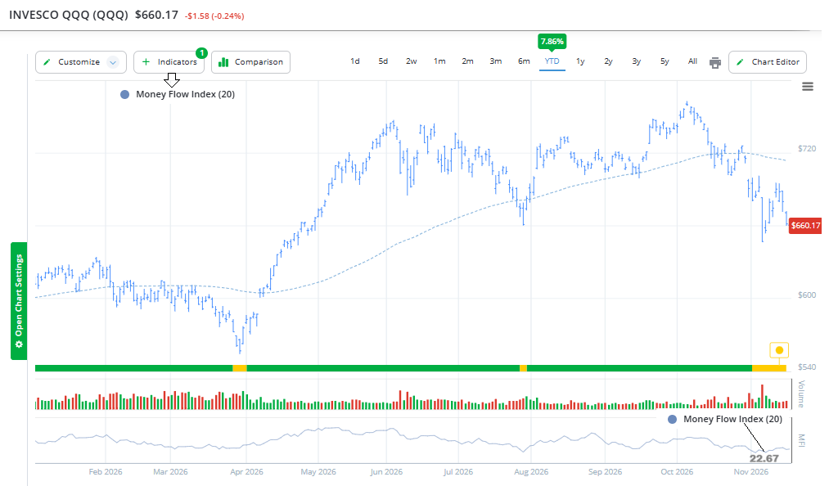
And sure enough, MFI fell below 25 recently – and held those low readings for multiple trading days. That’s a very oversold condition, as you can see in the QQQ chart below:
So now, the question I want our Signal Studies to answer is simply this: What happens to QQQ after posting an oversold MFI reading of 25 or less?
The Signal Studies tool analyzes every time in the trading history of QQQ that MFI was this low or lower, and calculates median future returns across multiple timeframes. The results tell you at a glance not just if QQQ has consistently rebounded from this oversold level in the past, but by how much as well.
Here are the results, straight from our tool:
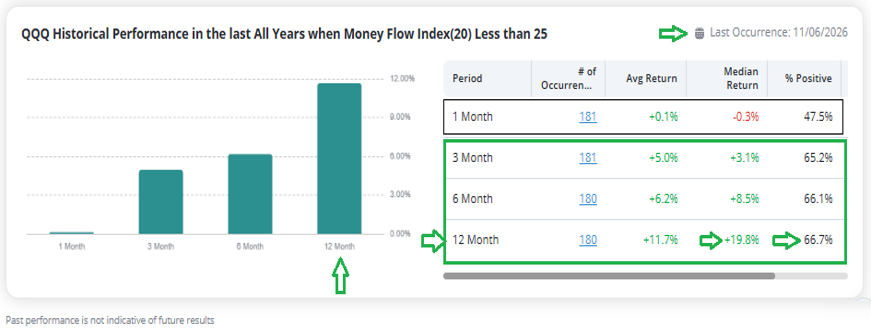
Historically, after QQQ has been this oversold based on MFI readings, returns have been mixed in the month following the signal. One month later, QQQ has only been higher 47.5% of the time – about the same as coin flip odds.
But 3 months later, QQQ has been up almost two-thirds of the time – with average gains of 5%. And just look at the 6- and 12-month returns shown above.
6 months later, QQQ has been up 66% of the time with median returns of 8.5%, and a year later the ETF has posted gains 66.7% of the time, with a median return of 19.8%!
This is based on 180 prior occurrences, which is a relatively large number over 25 years of trading!
Click on the blue highlighted link in the # of Occurrences column to view a detailed breakdown of every identified signal – running back to 1999, in this case.
Parsing through the data myself, here’s what I found: Out of 180 occurrences, QQQ gained 20% or more 22 times. And QQQ only fell by 20% or more 5 times out of the full 180.
Now, I am not saying that you should expect this exact level of upside gain this time around. But based on more than 25 years of historical data, we shouldn’t be too surprised if we do see a stunning rally for QQQ in the weeks ahead.
Bottom Line: When it comes to selecting new trades, I prefer to research “just the facts,” to quote Sgt. Joe Friday of Dragnet. And that’s exactly what our Signals Studies tool gives you.
Our Signals tool searches through past market trends, price and volume moves, and delivers just the facts about how an asset has performed in these conditions. And when it comes to the Nasdaq (QQQ), it’s clear to me that the recent oversold Money Flow Index reading could mean a potentially powerful rebound rally.
With over 25 years of supporting data, I’ll be keeping a close eye on the Nasdaq over the next 6 to 12 months!
Good investing,
Mike Burnick
Senior Analyst, TradeSmith
P.S. Signals by TradeSmith is one of the latest breakthroughs from TradeSmith’s R&D team. This cutting-edge trading system analyzes hundreds of stocks to uncover their hidden trading patterns – and with features like the Signals Studies tool, it’s an easy way to turn that data into high probability profit potential!
It’s one of the most powerful tools we’ve ever released, and it’s our latest effort to put hedge fund-level analytics at your fingertips.
Recently, our Signals research has pointed us in the direction of a major trading signal set to appear later this month – which is why we’re going live with a major Signals briefing TOMORROW, Wednesday, Nov. 18.
During the event, we’ll share all the details about Signals by TradeSmith, how everyday investors can use Signals to secure hedge fund-level profits, and how advanced trading tools like Signals could help you navigate the major shakeup set to arrive in just a few weeks.
You won’t want to miss out on this opportunity. Click here to register for tomorrow’s big event.