39% per trade… over 22 years!
|
Listen to this post
|
Almost two years ago, in August 2016, I first presented the results of an exhaustive study that demonstrated the power of the Stock State Indicator (SSI) signals. This might have been the most important piece of research we had ever done at TradeStops.
As we showed you here, going back to 1996 and covering almost 1300 tickers (individual stocks, indices, and commodities), we measured the effectiveness of the SSI signals as an investment tool.
Very simply, our test showed what would have happened if someone had bought a stock when the SSI Entry signal was triggered on the upside and exited that stock when the SSI Stop signal was hit on the downside.
Our original testing covered almost 7,500 trades. The original results came in with almost 53% being winners, and the winning trades outperformed the losing trades by a 5–1 margin.
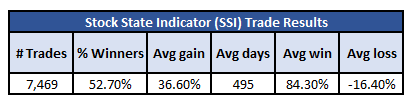
The Stock State Indicator signals had averaged a 36.6% gain per trade over this 20-year test period.
Now that the SSI signals have been an integral part of TradeStops for the past two years, we wanted to update the results. The above results were great but we wanted to know how the system has held up since our subscribers have had access to the SSI signals.
I have to admit, I was a little nervous about the results of this experiment. There’s always a risk that past performance won’t be indicative of future results. There’s always a risk that when you introduce new tools and techniques to the investing public that the edge that originally existed gets arbitraged away.
I’m thrilled to report that not only have the SSI indicators continued to perform well for the past couple of years, they actually appear to be performing even better.
Let’s get right to the updated results.
Using the Stock State Indicator signals over the now 22-year period of time gave us 56% winning trades! And the winners continued to outperform the losers by a 5-1 margin. The updated results and the original results are both in the table below.
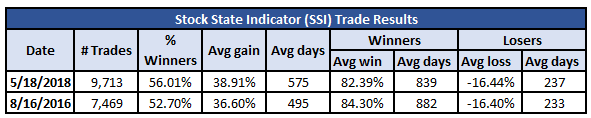
The average gain per trade moved from 36.6% to just under 39%. Our “Average Days” listed in the chart above are referring to calendar days, so the average holding period per trade was about a year and a half.
The average holding period for the winners was more than the average holding period for losers. This means that the SSI signals got you out of your losers fairly quickly, but they kept you in your winners a long time.
A good example is UnitedHealth Group (UNH), which triggered an SSI Entry signal in early June 2009. It has now been in an uptrend for almost 9 years without hitting its SSI Stop signal.
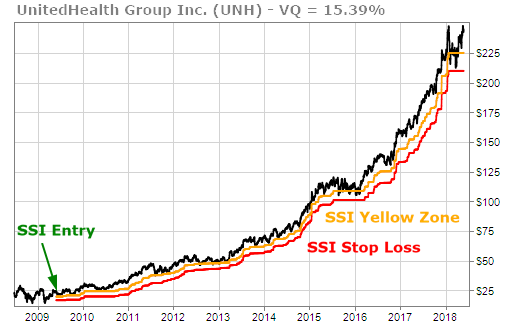
Nine years moving higher with the price going from under $25 to its current price of almost $250. And by the way, this happens to be the stock that Warren Buffett himself sold for a loss way back in 2010!
As I’ve said many times before, the successful investor knows that the key to large gains in the stock market is to limit your losses while un-limiting your gains. We developed the SSI tools for just that purpose.
As the market’s volatility has increased, knowing when to stay in or get out of a position has never been more critical. As a TradeStops member, you have that tool available just a click away.
Make More. Risk Less.